Signal is variation in data that matters for a particular question. In outlier detection, an unusual value is not automatically meaningful: what counts as noise in one context may be signal in another. The task is to expose potentially relevant differences, then judge whether they warrant attention. section 1.4
Signal may be hidden by the way data is recorded. Feature engineering can turn dates, repeated events, or relationships between columns into quantities a detector can assess. A ratio of home runs to at bats, for example, exposes unusually high rates that the original columns may not make obvious. These choices depend on which deviations would be useful to find; without a target label, judgment guides them. section 4.8
Useful signal can occur at several scales:
- A missing value can carry information. Preserve it with a binary indicator before filling the original column with a typical value; unusual patterns of missingness can then be tested. section 9.1
- A group can be unusual even when its individual records appear ordinary. Aggregate activity into one row per entity, using measures such as posting frequency and bursts. section 12.6
- A sequence can reveal an upward trend or unusual volatility despite normal individual readings. Summarize each entity’s history or add lags and recent averages to give records temporal context. section 12.7 section 17.2.5
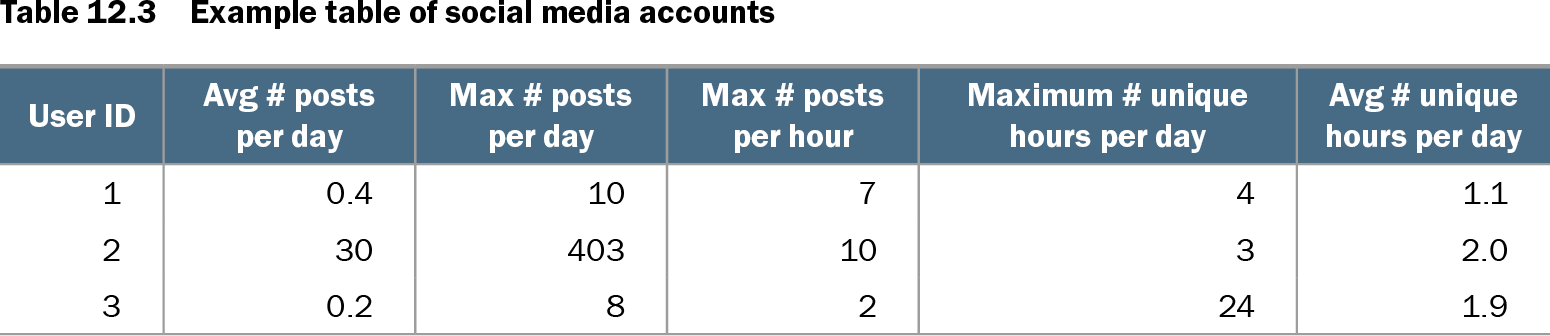
Table 12.3 Example table of social media accounts (view table figure)
| User ID |
Avg # posts per day |
Max # posts per day |
Max # posts per hour |
Maximum # unique hours per day |
Avg # unique hours per day |
|---|---|---|---|---|---|
| 1 |
0.4 |
10 |
7 |
4 |
1.1 |
| 2 |
30 |
403 |
10 |
3 |
2.0 |
| 3 |
0.2 |
8 |
2 |
24 |
1.9 |
The account-level table makes two distinct patterns visible: one account reaches 403 posts in a day, while another posts during all 24 hours of a day. Neither pattern is captured by a single message. section 12.6
More features do not necessarily mean more signal. Additional combinations can produce chance outliers and false positives, while irrelevant dimensions can obscure useful differences. Interpreting a result requires knowing what the features mean, which ones contributed to the score, and how they interacted; a score alone does not establish why a record matters. section 12.6.5 section 13.2.5