Uncertainty describes incomplete knowledge about information, outcomes, or underlying quantities. Statistics exposes patterns in noisy data, while quantitative methods support decisions about risk, forecasting, optimization, and complex systems. section 1.1.1 section 1.1.2
Quantify and interpret uncertainty by:
- Using Monte Carlo simulations to represent randomness, variability, dependencies, irregular distributions, and current data. section 9.4.1
- Comparing possible outcomes to assess risk, plan best- and worst-case scenarios, and support decisions. section 9.5.7 section 9.5.8
- Treating long-horizon forecasts cautiously because uncertainty accumulates and reduces precision over time. section 9.5.7
Staffing and stock-price decisions
A call center simulation suggests overstaffing by three or four rather than two, trading lower understaffing risk for higher payroll cost. A stock-price simulation compares ending prices with the starting price and summarizes the broader range of possible outcomes. section 9.4.1 section 9.5.8
Figure 9.5 500 Monte Carlo simulations of GM’s closing stock price for January 2024. Each line corresponds to a single simulation, depicting potential stock price trajectories based on the historical mean and volatility of log returns.
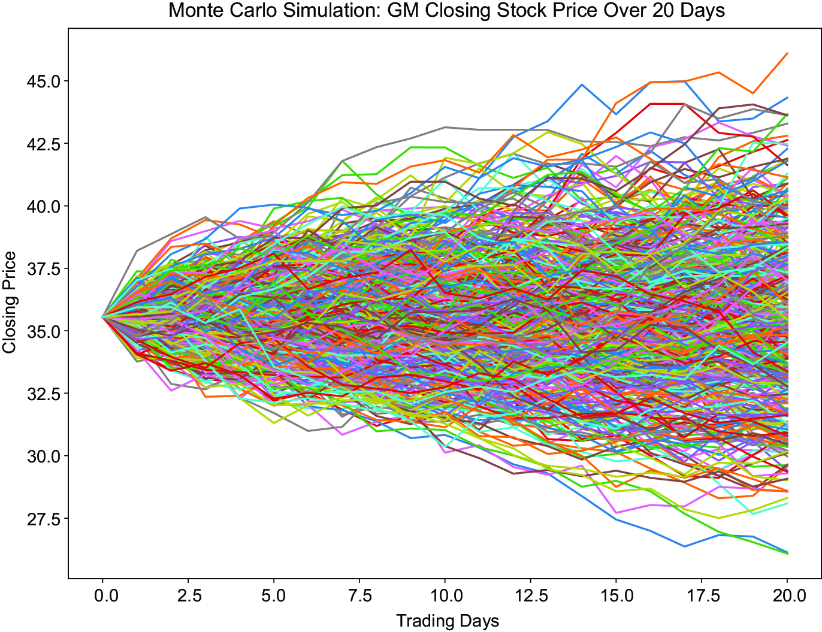
Inspect simulated stock-price trajectories to see clustered likely paths, divergent scenarios, and uncertainty widening across the forecast horizon. section 9.5.7
>>> all_simulations = \
>>>     simulation_df.values.flatten()   #1
>>> overall_stats = pd.DataFrame(all_simulations,
>>>         columns = ['Simulated Prices']).describe() #2
>>> print(overall_stats)     #3
       Simulated Prices
count      10500.000000
mean          35.559536
std            2.204029
min           25.996207
25%           34.261598
50%           35.691632
75%           36.821081
max           47.983021
Inspect descriptive statistics computed across flattened simulations, including the mean, standard deviation, quartiles, and extreme values. section 9.5.8