AUC is the area beneath a receiver operating characteristic (ROC) curve, a graph that tracks a classifier’s sensitivity and specificity as its threshold changes. It compresses that curve into one score for evaluating the model. section 7.3 section 7.4
Comparing model scores
For three illustrated ROC curves, counting grid squares gives AUC values of 0.52, 0.72, and 1. A score of 1 is best; 0.5 corresponds to random guessing. A score of 0 can indicate predictions that are all reversed, which can be corrected by flipping them. section 7.3
Figure 7.5 In this figure, we can see that AUC, or area under the curve, is a good metric to determine how good a model is. The higher the AUC, the better the model. On the left, we have a bad model with an AUC of 0.52. In the middle, we have a good model with an AUC of 0.72. On the right, we have a great model with an AUC of 1.
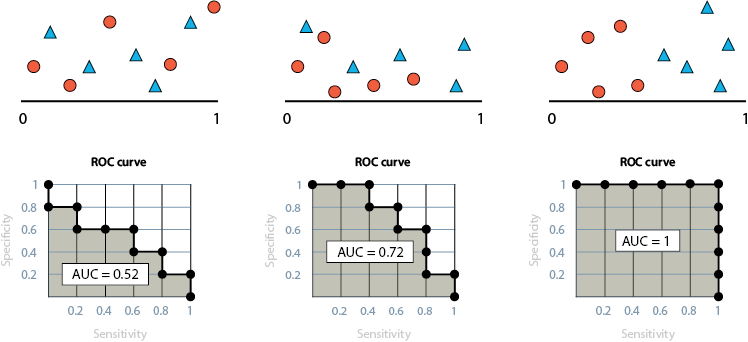
Compare the ROC curves associated with AUC scores of 0.52, 0.72, and 1. section 7.3











