liveBook · Manning

Area under the curve

As explained in Machine Learning Algorithms in Depth

Area under the curve is a scalar summary of the area beneath a performance curve, with larger values indicating better ranking performance in the ROC sense.

Area under the curve (AUC) summarizes ROC curve quality with one number. The ROC curve plots true positive rate against false positive rate as the classification threshold varies. Higher AUC indicates better ranking performance; the maximum is 1. section 5.2
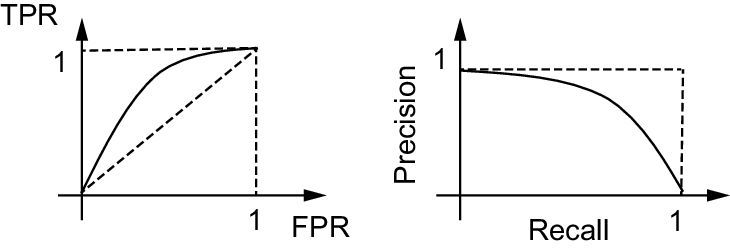
Figure 5.4 Receiver operating characteristic (ROC) plot (left) and precision-recall plot (right)
figure

Compare how changing the classification threshold traces ROC and precision-recall curves. section 5.2


How Machine Learning Algorithms in Depth covers it

How deep it goes
Defines AUC and its interpretation but does not derive its calculation.
Examples
Uses a figure comparing ROC and precision-recall plots.
What you can do after
Evaluate classifier ranking performance from its ROC curve summary.
How it connects
Connects AUC to ROC curves, classification thresholds, true positive rate, and false positive rate.

Also explained in

Compare how 12 books explain area under the curve →

Related concepts

This explainer was generated by Manning's knowledge graph from the text of Machine Learning Algorithms in Depth. The section links point to the parts of the book it draws on.









