AUC summarizes a binary classifier’s ability to distinguish positive from negative classes across classification thresholds. Unlike accuracy, it focuses on discrimination, which can reveal weakness on an imbalanced dataset. section 5.2.4
AUC ranges from 0 to 1; values near 1 indicate strong performance. A value of 0.5 corresponds to random guessing. AUC and accuracy can differ, though they aligned for a balanced raisin-classification example. section 5.2.4
Scikit-learn evaluation
For raisin classification, roc_auc_score returned 0.8678, matching the model’s 86.78% accuracy in this balanced example. section 5.2.4
Figure 5.4 A ROC curve. The false positive rate is plotted along the x axis, and the true positive rate is plotted along the y axis. When the curve, represented by the solid line, hugs the upper-left quadrant of the plot, as it does here, it increases the area under the curve. The dashed line represents an AUC equal to 0.5, or the equivalent of random guessing.
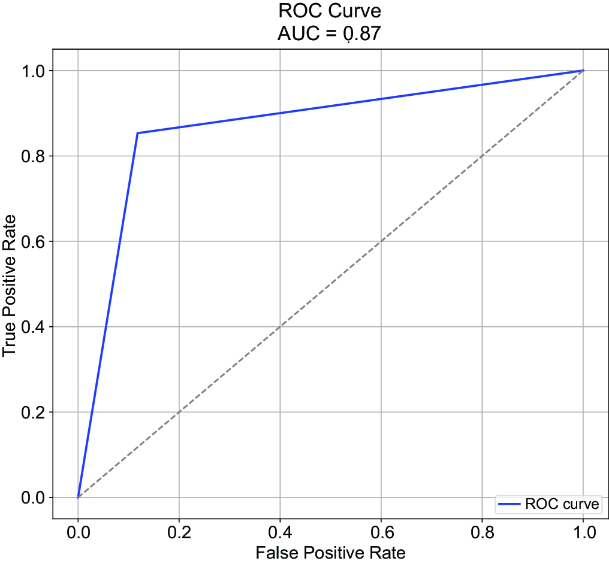
The ROC plot relates false-positive and true-positive rates; a curve nearer the upper-left corner encloses more area. section 5.2.4











