Causation asks what would change if you changed something else. If changing X changes Y, X may cause Y. This differs from prediction: a hospital can predict which patients may become sick without knowing what action would prevent illness. Causal questions focus on decisions—such as prices, marketing, product features, policies, or treatments—and the outcomes those decisions can alter. section 1.0 section 4.0
A correlation alone does not establish a causal relationship. Two variables can move together because of a common cause, or because the observed pattern reflects a particular context rather than the effect of an intervention. The useful question is not merely whether X and Y are associated, but what would happen to Y if X were deliberately changed. section 1.4 section 1.3.2
Website versions and visits
Suppose a new website version receives more visits than the old one. That difference is not automatically caused by the redesign: a simultaneous marketing campaign or a different mix of visitors could explain it. A fair comparison tries to hold context and user type alike, ideally showing both versions at the same time. An A/B test or randomized controlled trial is the most reliable way to establish an outcome difference with statistical confidence, though it may not reveal which specific design change produced it. section 1.3.2 section 1.3.4
Causal models make assumptions explicit. In a directed acyclic graph, an arrow X → Y represents a potential effect of X on Y; omitted arrows also express assumptions about absent direct effects. Models can include confounders, which influence both treatment and outcome, and mediators, which lie along an effect pathway. Their complexity should suit the decision and the credibility of their assumptions. section 1.1.3 section 3.2.2
Figure 1.4 Both arcade revenue and computer science doctorates increase when the population increases, so the population is a potential common cause between the two.
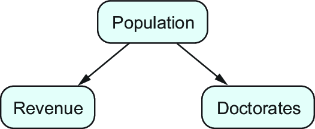
Use the graph to inspect how population can create an association between arcade revenue and computer science doctorates without either causing the other. section 1.4
When using observational data to make a causal judgment:
- State the treatment, outcome, and plausible confounders; missing relevant confounders is the central risk. section 2.9
- Draw a causal graph to communicate the objective and assumptions, then use it to decide whether adjustment is appropriate. section 2.9
- Check positivity: the treatment must have occurred previously in the situation being evaluated. section 2.9
- Treat regression coefficients as correlations until the causal model and included variables justify a causal interpretation. section 6.0







