Causation means that changes in one factor produce changes in another. In business analysis, a visible relationship is a useful starting point, not proof that one variable causes the other. section 3.4.4
Correlation can mislead
Sleeping with shoes on correlates with morning headaches because alcohol overuse may influence both. Ice-cream sales and violent crime rise together during heat waves. Blond hair and ice-skating skills may appear related because geography affects both. These patterns require a logical causal link and consideration of third factors before supporting a conclusion. section 3.4.4
Use observed relationships carefully:
- Use scatterplots, heatmaps, and regression analysis to identify relationships among prices, freight values, order values, and other measures. section 4.3 section 3.4.4
- Check whether geographic factors, product categories, or another third factor could explain the observed pattern. section 4.3 section 3.4.4
- Validate analytical conclusions and generated code instead of treating an AI interpretation as automatically correct. section 3.4.4
Figure 4.2 Scatterplot of relationships between average payment values, average freight values, and average product prices
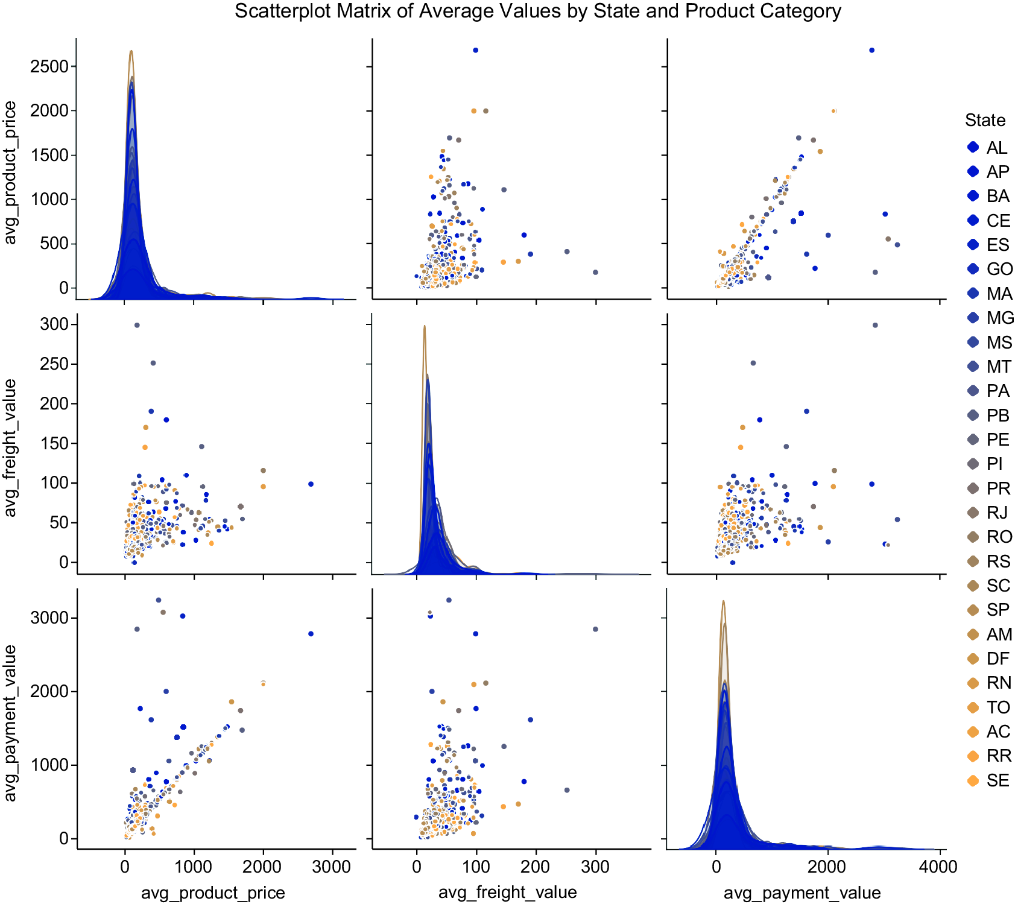
Inspect the scatterplot of payment values, freight values, and product prices to locate relationships that may require causal investigation. section 4.3







