Should you wear a jacket? You might first ask whether it is raining, then—if it is not—whether it is cold. A decision tree makes predictions in the same way: start at the root, follow the branch matching each answer, and stop at a leaf. Each decision node asks a yes-or-no question about a feature; each leaf gives a prediction. Trees can predict either a class or a number. section 9.0
To build a classification tree, start with labeled examples. Compare questions that split them into two groups, choose the question that best separates their labels, and repeat within the resulting groups. At a leaf containing mixed labels, predict the most common one. section 9.2
Choosing a question for app recommendations
Suppose six users have a platform, an age, and a downloaded app. Splitting by platform leaves both groups with mixed app choices. Splitting by whether a user is under 20 puts all three younger users—who downloaded the same app—together. With majority-label predictions, the age split gets five of six training examples right, versus four of six for platform. Split the remaining adult group by platform, and each resulting leaf contains one app choice. section 9.1 section 9.2
There are several ways to choose a classification split:
- Accuracy counts correct predictions when each new leaf predicts its majority label. section 9.2
- Gini impurity measures how mixed a group’s labels are: for label proportions p₁ through pₙ, Gini = 1 − (p₁² + … + pₙ²). A group with one label has impurity zero. section 9.2 section 9.8
- Entropy is another measure of label mixture. Compare the groups’ average impurity after each split; when groups differ in size, weight each by its share of examples. The reduction in entropy is information gain. section 9.2 section 9.8
Figure 9.8 If we split our users by age, we get this split: the young are on the left, and the adults on the right. Out of the young users, all three downloaded Atom Count. Out of the adult users, one downloaded Beehive Finder and two downloaded Check Mate Mate.
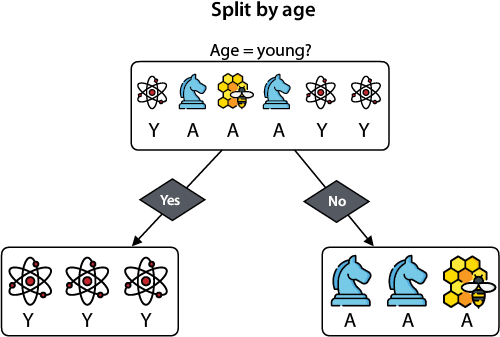
The age split makes one group pure while leaving a smaller, mixed adult group for another question. section 9.2
A numerical feature can be tested against a cutoff. In a two-feature plot, successive feature cutoffs form vertical and horizontal decision boundaries. For regression, the questions still divide the data, but each leaf predicts a number: the average label in its group. Candidate splits are compared using mean square error (MSE) rather than classification accuracy, Gini impurity, or entropy. section 9.4 section 9.6
Predicting app engagement
Given users’ ages and days of app use per week, try age cutoffs and compute the MSE of each split. A cutoff at 35 has the lowest MSE among the listed first-split candidates. Further splits give different groups fixed predictions. In Scikit-Learn, a DecisionTreeRegressor with max_depth=2 fits this age-and-engagement data. section 9.6
Try building just the first node yourself: for the supplied transaction data, compare questions about transaction value and approved-vendor status using Gini impurity, then entropy. A tree’s questions can help explain which features drove a prediction—a useful property in settings such as health care—but a correct prediction on its training examples alone does not describe how it will perform on new ones. section 9.9 section 9.7 section 9.2












