A decision tree maps a choice under uncertainty as branching paths. Decision nodes represent available actions; chance nodes represent events outside the decision-maker’s control. Chance branches carry probabilities, and their endpoints carry payoffs. Unlike a predictive decision-tree model trained to classify data, this tree evaluates specified choices and possible outcomes. section 10.2
Build the tree before calculating which action to take:
- Identify the main choice and any variables that change the payoff, such as fees. section 10.2.1
- Label decision and chance nodes. List every relevant outcome and assign each chance branch a probability; probabilities leaving one chance node must sum to 1. section 10.2.1
- Attach payoffs to the endpoints. Work backward: multiply each payoff by its branch probability, sum at each chance node, account for costs, then compare the actions’ expected values. section 10.2 section 10.2.1
Compare two contract offers
Suppose one offer pays $120 million. The other has performance-dependent payoffs and a $13 million agent fee. Its expected payoff is $138 million if the player stays healthy and $117 million otherwise. With health probabilities of 0.75 and 0.25, calculate `0.75 * 138 + 0.25 * 117 - 13` in millions: $119.75 million. On these specified payoffs and probabilities, the $120 million offer has the higher expected value. Check the probability and payoff estimates before treating that narrow difference as decisive. section 10.2.1
Figure 10.1 A decision tree that illustrates two very different contract offers. The tree outlines the expected payoffs based on different states of nature, allowing the player to accept the contract with the highest expected value.
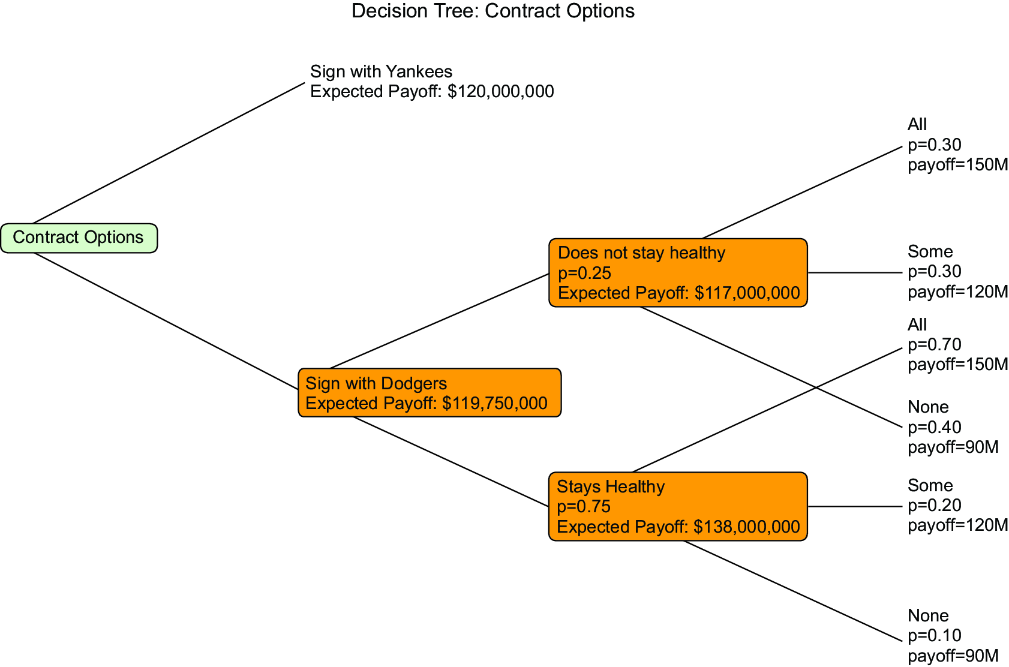
The plotted contract tree makes the alternatives, uncertain outcomes, and expected payoffs visible together. section 10.2.2
A readable plot labels probabilities and expected payoffs and visually distinguishes decision nodes from chance nodes. Python’s `anytree.Node` can store the hierarchy; Matplotlib can draw it. The result supports comparison, but its recommendation depends on the supplied probabilities, payoffs, and costs. section 10.2.1 section 10.2.2












