A decision tree regression predicts a continuous outcome by dividing data into regions with a series of if-else rules. Each split uses a predictor value, and the endpoint of each branch supplies a predicted value for that subset. Because the result is drawn as an upside-down tree, it can be easier to interpret and explain than a linear regression. section 5.0 section 5.8
Read the tree from top to bottom. Early splits are more significant than splits near the bottom, while terminal nodes, or leaves, are the endpoints where predictions are attached. A tree need not use every candidate predictor, even when all are included in the model formula. section 5.8
Fit and inspect a regression tree in R:
- Load the tree package, then fit a model with tree(), using a continuous target and selected predictors. section 5.1 section 5.8
- Call summary() to inspect terminal-node count and residual mean deviance; its square root is a rough average prediction difference. section 5.8
- Call plot() and text() to visualize the splits and predicted values as a tree. section 5.8
- Compare the tree’s selected predictors with results from a linear regression when checking whether both models identify similar influential variables. section 5.9
Which hustle statistics relate to wins?
Regular-season wins are modeled from points off screens, deflections, loose balls recovered, contested two-point shots, and contested shots. The fitted tree produces 10 terminal nodes and highlights points from screens, deflections, and loose balls recovered as more influential than the other hustle measures. Its rules yield predicted wins for each region of the data. section 5.8 section 5.9
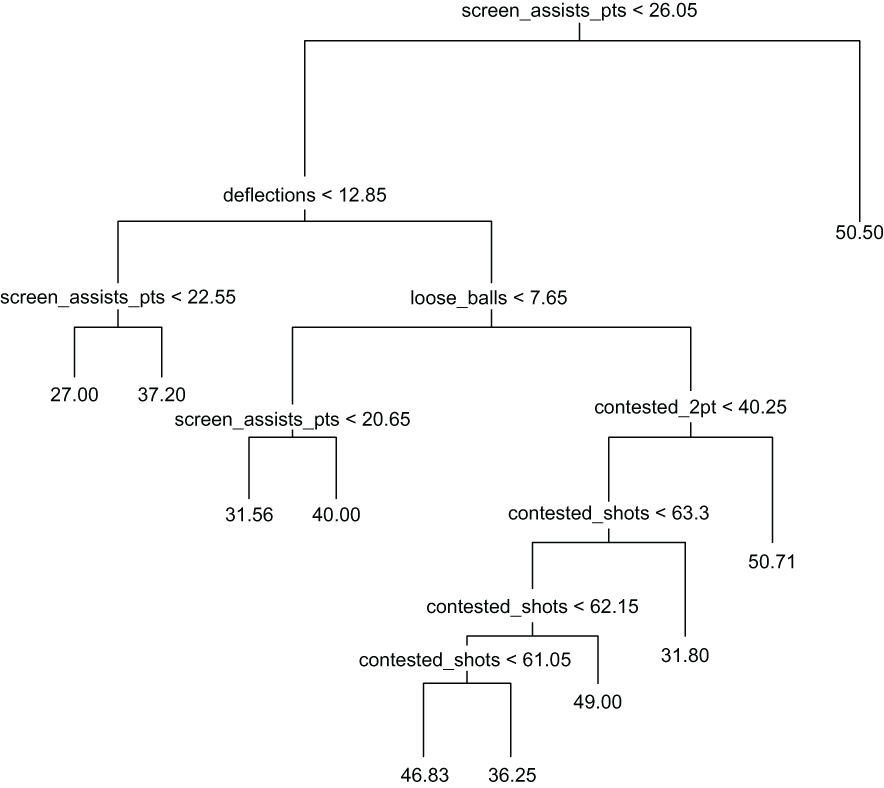
Use the plotted tree to trace the major predictor splits from the root to terminal predictions. section 5.8
Trees trade some accuracy for clarity: a single regression tree can be relatively easy to build and explain but may be less accurate than other supervised-learning methods. Bagging, random forests, and boosting address this by combining many trees into one prediction. section 5.8
For a binary target, the same tree() syntax can fit a classification tree rather than a regression tree. The key distinction is the target: regression trees use continuous outcomes, while classification trees require binary outcomes. section 5.9












