Fairness evaluates whether a model’s errors and improvements are distributed equitably. A lower average error is not automatically better if gains concentrate in one group while other groups worsen. section 9.2.4
Use fairness as a broader evaluation and monitoring check:
- Compare residual distributions, not only a single aggregate metric such as MAE. section 9.2.4
- Check whether improvements are spread across samples or concentrated in a particular stratum. section 9.2.4
- Track model quality by segment, such as geographic or other subpopulation groupings, to reveal performance discrepancies. section 14.4.3
- For quantitative assessment, sort absolute residuals and calculate the Gini index: zero indicates equal contributions, while one indicates extreme concentration. section 9.2.4
Equal MAE improvement, unequal experience
Two models each reduce MAE by 20% across ten samples. Prefer the model that reduces absolute residuals uniformly; the alternative improves one half while worsening the other, adding inequality to the residual distribution. section 9.2.4
Figure 9.16 Fair vs. unfair residual distribution
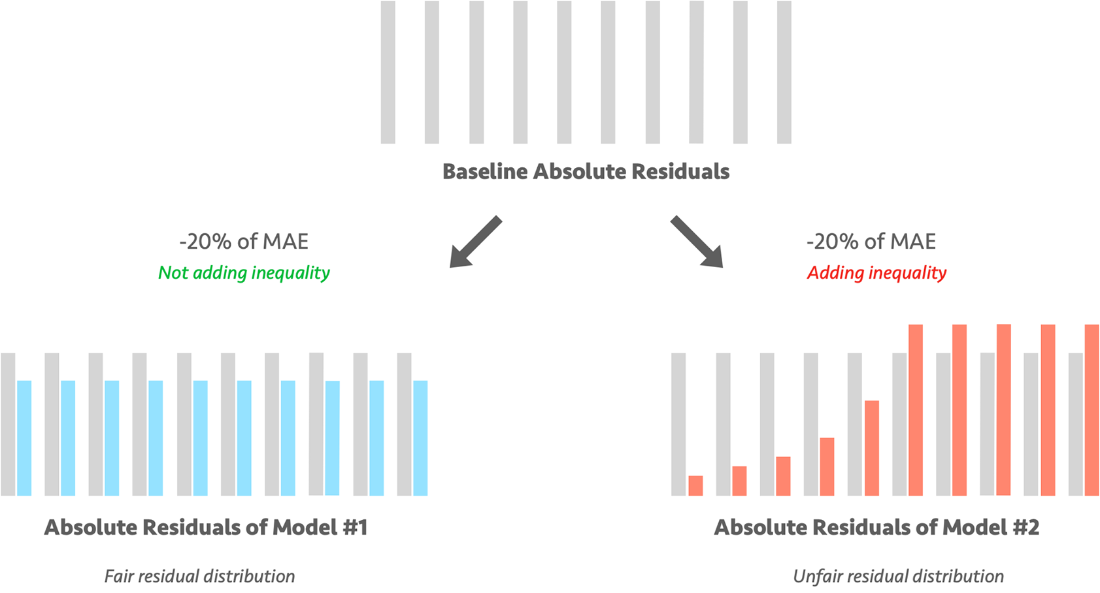
Compare the fair and unfair residual distributions visually before relying on a single score. section 9.2.4
Figure 9.17 Graphical representation of the Gini coefficient: the graph shows that the Gini coefficient equals the area marked A divided by the sum of the areas marked A and B—that is, Gini = A/(A + B). It is also equal to 2A and to 1 − 2B because A + B = 0.5 (since the axes scale from 0 to 1).
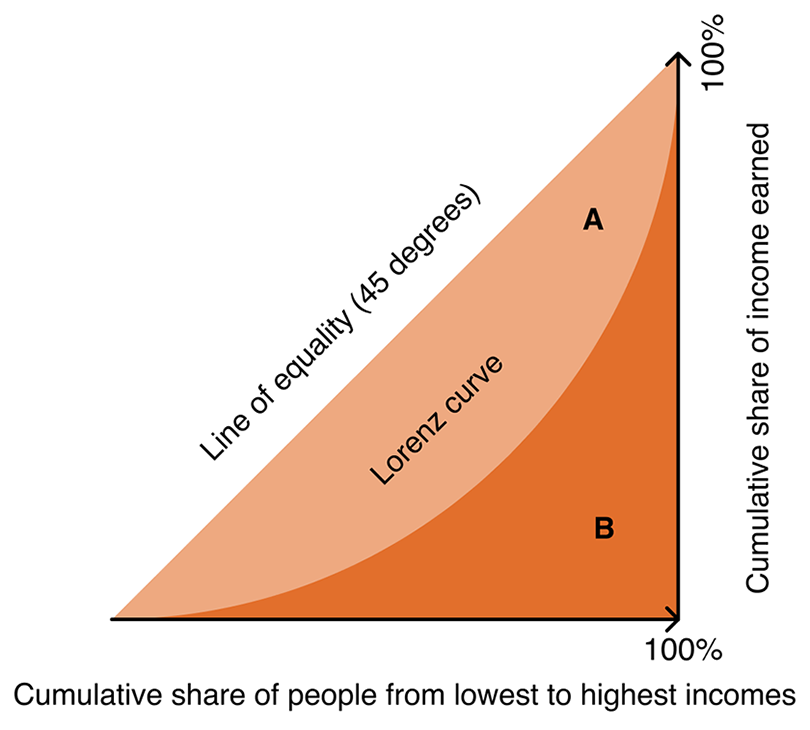
Use the Gini diagram to interpret how residual concentration maps to the fairness score. section 9.2.4









