A digital image gives a data story’s subject a concrete visual representation. Adding photos or illustrations clarifies context, guides interpretation, and can establish an emotional tone. section 8.5
Use images to strengthen a chart or visual narrative by:
- Giving an abstract subject a recognizable face. section 8.5
- Reinforcing a selected message, mood, or comparison. section 8.7
- Adding generated visuals directly to an Altair chart through image URLs and mark_image(). section 4.5.2
- Prefer original generated images when copyright restrictions make downloaded photos risky. section 5.4.2
A homelessness chart
A homelessness visualization uses two DALL-E-generated photos to represent homeless individuals. The images add context to the title and subtitle while making the topic more immediate. section 5.4 section 5.4.2
Figure 5.18 The photos generated by DALL-E when prompted with a photo of a homeless individual
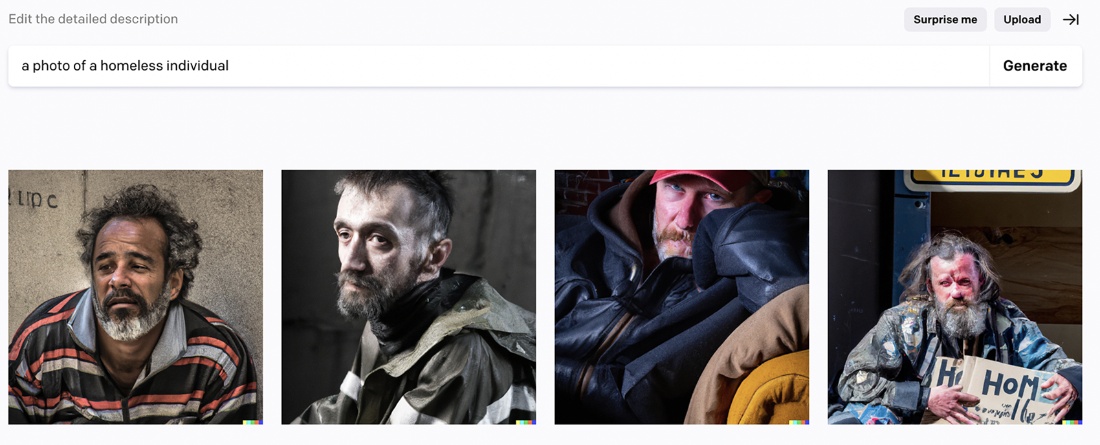
Inspect the generated-photo example used to represent people in a homelessness data story. section 5.4.2