Interpretability asks why a ConvNet makes a particular prediction—for example, calling an image a fridge when it appears to show a truck. This matters when models complement human expertise, especially in medical imaging. ConvNets are unusually suitable for visualization because their learned representations correspond to visual concepts. section 10.0
Use these visualizations to inspect what the network learns and how it decides:
- Visualize intermediate activations to see how successive layers transform an image and to infer what individual filters detect. section 10.0
- Visualize filters to identify the visual patterns or concepts to which they respond. section 10.0
- Use class activation heatmaps to identify image regions supporting a particular class and to localize objects. section 10.0 section 10.3
- Inspect semantically organized image manifolds to find outliers, ambiguous images, and opportunities to improve training or evaluation data. section 10.0
Explaining an elephant prediction with Grad-CAM
A pretrained Xception model classifies an image of African elephants. Grad-CAM takes the output feature map from a convolution layer, weights each channel by the gradient of the target class, and produces a spatial heatmap showing where the image activates that class. The heatmap can reveal which regions supported the prediction and help debug a mistake. section 10.3
Figure 10.7 Test picture of African elephants
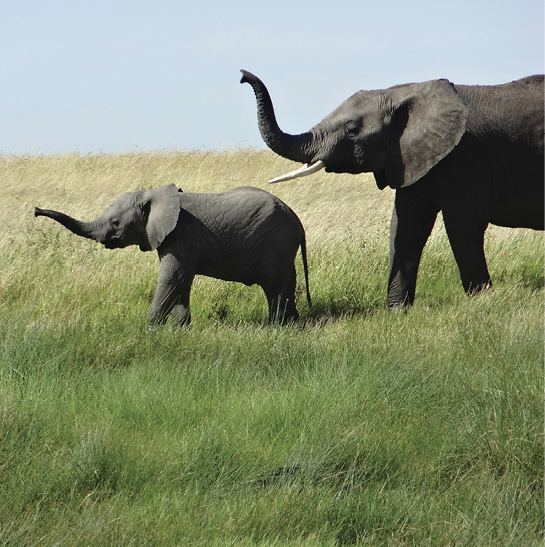
Use the African-elephant test image as the concrete input for prediction and heatmap interpretation. section 10.3















