Interpretability is the practical ability to understand how a model works, why it makes a prediction, and which inputs most influence its behavior. It matters when business stakeholders must trust decisions or regulators require comprehensible explanations. section 3.2.3
Predicting time on the market
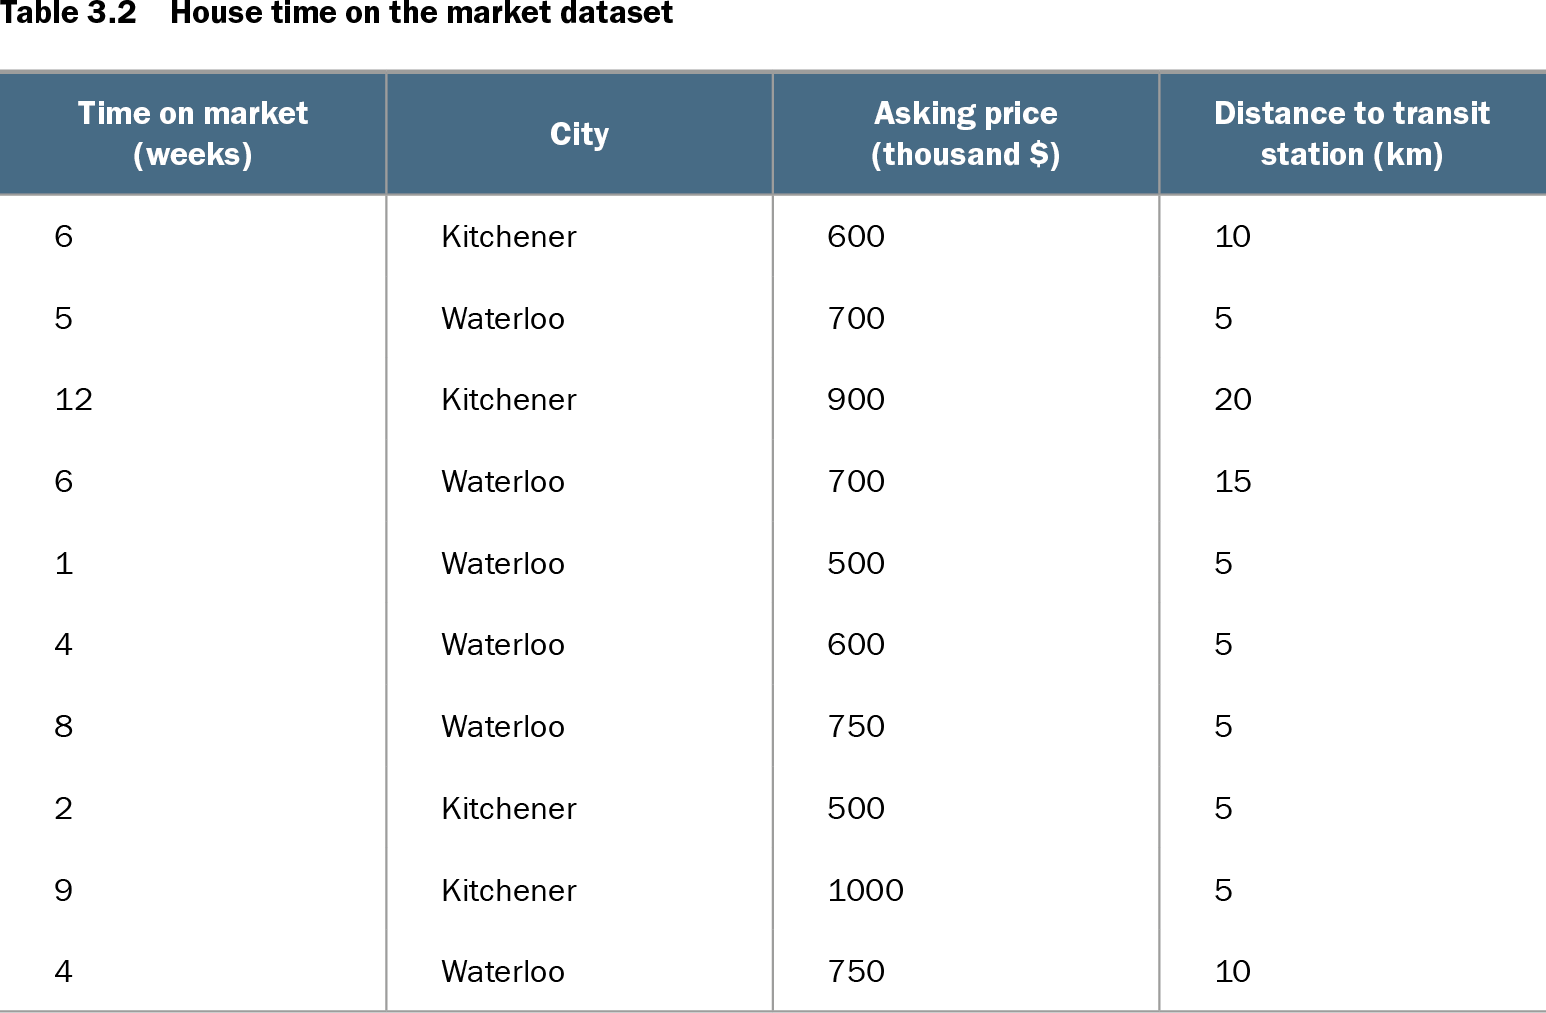
Consider a model predicting whether a newly listed house will remain unsold for more than a month. City, asking price, distance to transit, and historical time on the market provide a small, concrete setting for asking why the model reached its prediction and which feature mattered most. section 3.2
Interpretability differs sharply across model families. A decision-tree-style explanation can be followed as a sequence of conditions, while a neural-network diagram may show structure without revealing how training produces a result. Zooming into individual nodes or comparing them with biological neurons does not necessarily clarify the model and may create misleading intuitions. section 3.2.1
Practical ways to improve and use interpretability include:
- Prefer models and tooling that expose useful explanations when transparency is important; XGBoost provides a built-in feature-importance API, whereas Keras does not provide one by default. section 3.2.3
- Select relevant features before training to reduce clutter, clarify captured relationships, and make the decision process easier to communicate. section 6.2
- Use explanations to build trust, support debugging, satisfy regulatory expectations, and help people validate or improve AI-assisted decisions. section 7.2.6
Table 3.2 House time on the market dataset (view table figure)
| Time on market (weeks) |
City |
Asking price (thousand $) |
Distance to transit station (km) |
|---|---|---|---|
| 6 |
Kitchener |
600 |
10 |
| 5 |
Waterloo |
700 |
5 |
| 12 |
Kitchener |
900 |
20 |
| 6 |
Waterloo |
700 |
15 |
| 1 |
Waterloo |
500 |
5 |
| 4 |
Waterloo |
600 |
5 |
| 8 |
Waterloo |
750 |
5 |
| 2 |
Kitchener |
500 |
5 |
| 9 |
Kitchener |
1000 |
5 |
| 4 |
Waterloo |
750 |
10 |
Use the house-market table to inspect how a small set of recognizable predictors supports an interpretable prediction problem. section 3.2