Interpretability makes an outlier score understandable: which properties of a record led a detector to treat it as unusual? This matters when checking whether a detector is right for the right reasons and when investigating records it flags in production. A high score alone does not establish that a record is a meaningful anomaly. section 13.0 section 13.1
There are two ways to make a detector’s behavior understandable:
- Use an inherently interpretable detector. Univariate tests expose unusually small or large values; association rules expose patterns a record does or does not satisfy. Even simple scores can be hard to compare when many features are extreme. section 13.1.1
- Explain a black-box detector after scoring. Post hoc techniques seek to show why particular records received their scores; the explanation is an account of the detector’s behavior, not necessarily of what is truly anomalous. section 13.1.1 section 13.2
Investigating a flagged transaction
An auditor examining an unusually scored journal entry needs more than its rank. If the posting staff member’s seniority drove the score, knowing that feature gives the auditor a specific lead to investigate; the flag itself does not prove misconduct. section 13.0
A useful explanation combines an understanding of how the algorithm evaluates records, the score rather than only a binary label, meaningful feature names, the features most relevant to the score, and how those features interact. Choose plots, tables, or prose to suit the audience without hiding uncertainty or the subjective nature of outlier detection. section 13.2.5
Make feature pairs visible
A detector can be run separately on two-feature subspaces, then the pairs contributing most to a record’s score can be inspected. This supports clear local explanations and contour plots when the number of pairs is manageable. It cannot find an outlier that appears only through a relationship among three or more features; combined two-dimensional scores may also disagree with a full-feature model. section 13.3.1
Figure 13.10 An explanation of the top-scored record in the dataset given an ensemble of 2D models. In all four subspaces, the record (shown here as a star) is distinctly anomalous. In this example, each subspace includes the Height feature, suggesting its value is incongruous with the other values for this record.
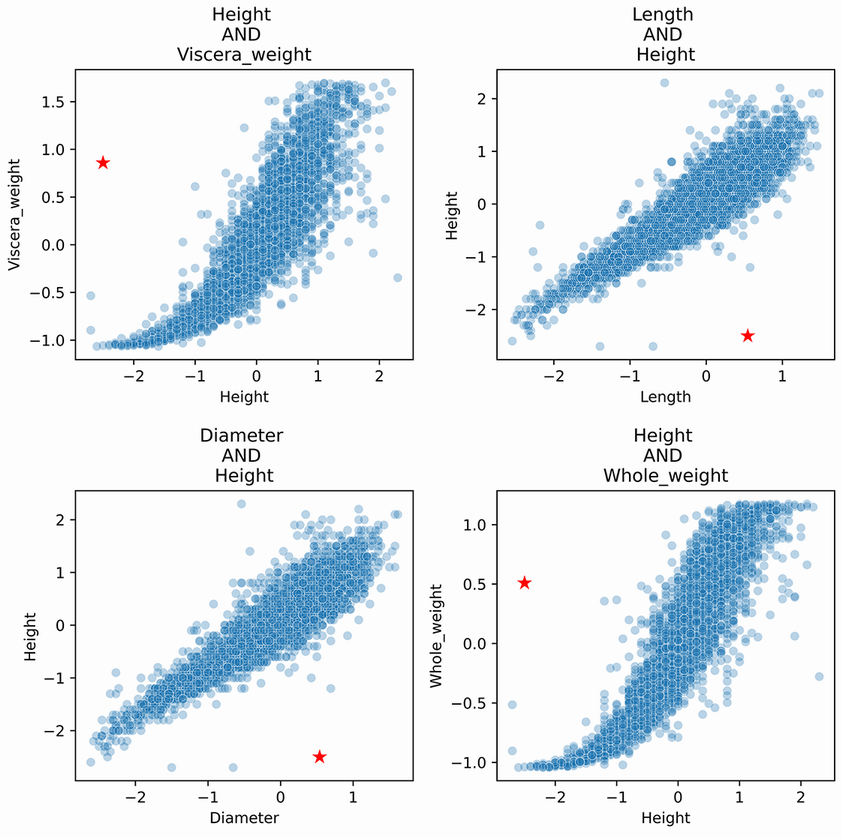
The highlighted abalone record is unusual in four feature pairs, each including Height, making the source of its high score visible. section 13.3.1
Counterfactual explanations offer another question: what minimal changes would make a flagged record count as an inlier? They describe a route across the detector’s decision boundary, not a verified correction to the underlying record. Explanation quality and comprehensibility vary with the detector, technique, dataset, and audience. section 13.2.4 section 13.2.5















