Pandas is a Python package for opening, manipulating, and saving datasets. It helps prepare data for machine learning, including handling problems such as missing values. section 13.7
A Titanic passenger dataset makes the workflow concrete: load a CSV, inspect its rows and columns, select fields, and count survival outcomes. section 13.1
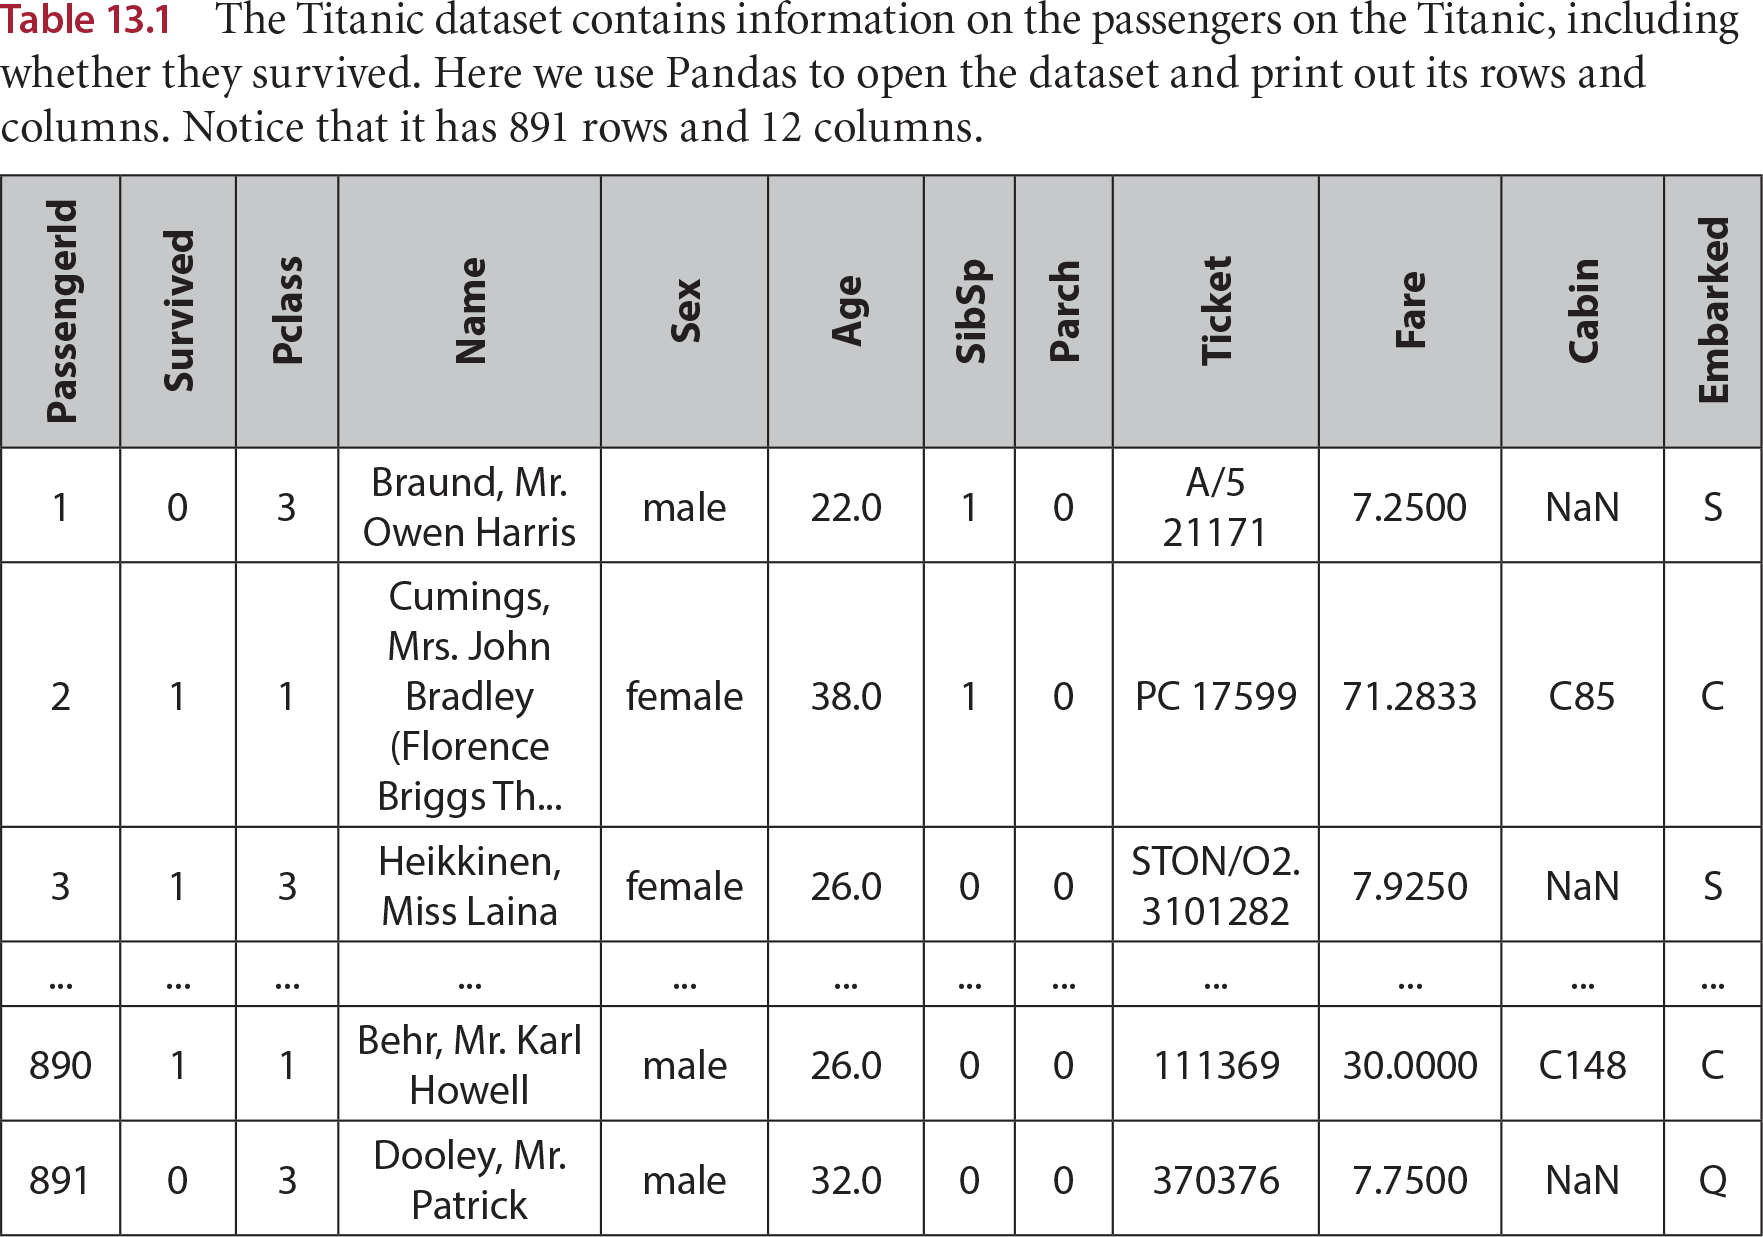
Table 13.1 The Titanic dataset contains information on the passengers on the Titanic, including whether they survived. Here we use Pandas to open the dataset and print out its rows and columns. Notice that it has 891 rows and 12 columns. (view table figure)
| PassengerId |
Survived |
Pclass |
Name |
Sex |
Age |
SibSp |
Parch |
Ticket |
Fare |
Cabin |
Embarked |
| 1 |
0 |
3 |
Braund, Mr. Owen Harris |
male |
22.0 |
1 |
0 |
A/5 21171 |
7.2500 |
NaN |
S |
| 2 |
1 |
1 |
Cumings, Mrs. John Bradley (Florence Briggs Th... |
female |
38.0 |
1 |
0 |
PC 17599 |
71.2833 |
C85 |
C |
| 3 |
1 |
3 |
Heikkinen, Miss Laina |
female |
26.0 |
0 |
0 |
STON/O2. 3101282 |
7.9250 |
NaN |
S |
| ... |
... |
... |
... |
... |
... |
... |
... |
... |
... |
... |
... |
| 890 |
1 |
1 |
Behr, Mr. Karl Howell |
male |
26.0 |
0 |
0 |
111369 |
30.0000 |
C148 |
C |
| 891 |
0 |
3 |
Dooley, Mr. Patrick |
male |
32.0 |
0 |
0 |
370376 |
7.7500 |
NaN |
Q |
The displayed Titanic data has 891 passenger rows and 12 columns, including age, fare, and survival. section 13.1