Probability measures how likely an event is. A probability can describe a simple event, such as rain, or a prediction, such as whether a sentence is happy. Conditional probability narrows the question: P(A|B) means the chance that A occurs when B is already known. section 1.3 section 6.2
Machine-learning predictions use probability in several practical ways:
- A sigmoid function converts any score into a number between 0 and 1, which can represent the probability of a positive class. section 6.2
- Bayes’ theorem combines a general base rate with test evidence instead of treating test accuracy as the final probability. section 8.1
- Word counts estimate probabilities for spam detection: lottery appears in 9 spam and 1 ham email, giving a spam probability of 0.9. section 8.12
A positive test is not the whole story
Imagine one million people. If 1 in 10,000 has a disease, about 100 people are sick and 999,900 are healthy. A test that is correct 99% of the time identifies about 99 sick people but also falsely marks about 9,999 healthy people as sick. Among 10,098 positive results, only 99 are genuinely sick, so the positive result represents roughly a 0.98% chance of disease. section 8.1
Figure 8.1 Among our 1,000,000 patients, only 100 of them are sick (bottom row). Among the 10,098 diagnosed as sick (left column), only 99 of them are actually sick. The remaining 9,999 are healthy, yet were misdiagnosed as sick. Therefore, if our friend was diagnosed as sick, he has a much higher chance to be among the 9,999 healthy (top left) than to be among the 99 sick (bottom left).
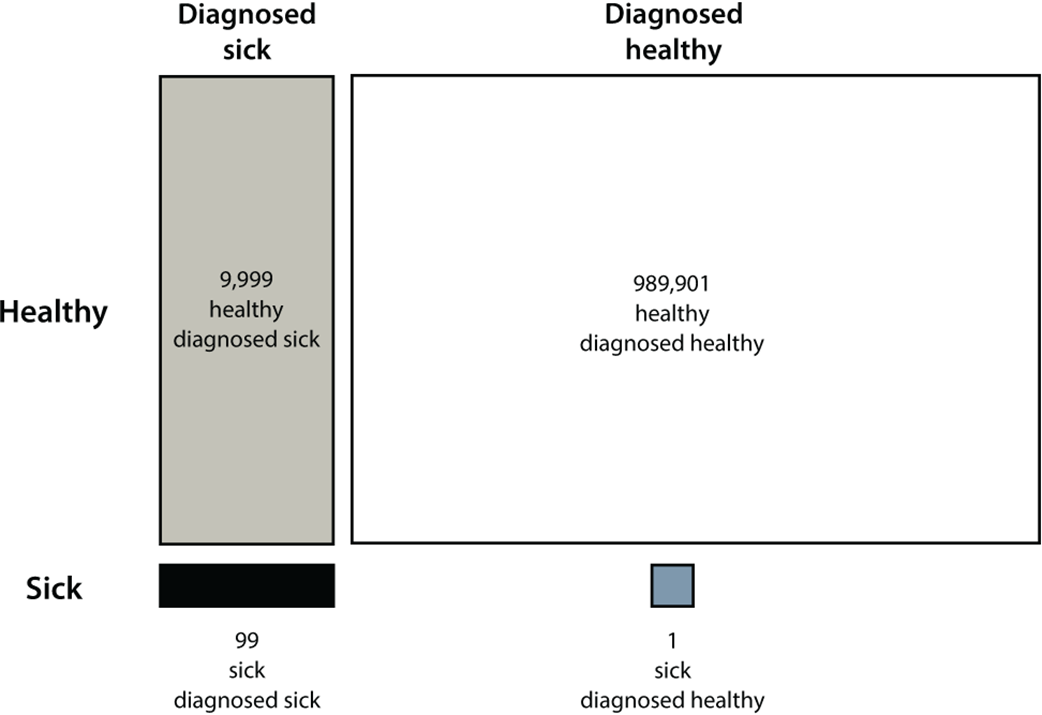
The confusion matrix makes base rates visible by separating genuinely sick people, correctly identified patients, and false positives. section 8.1