A threshold is a defined boundary for a security metric: it marks an acceptable level of risk and indicates when a team should act. A useful threshold specifies what is measured, over what period, and what happens when the boundary is crossed. For example, 10 failed login attempts in 10 minutes might trigger an alert for a possible brute-force attack. section 3.2.3
Choose the boundary using historical incidents, normal activity, regulatory requirements, business priorities, and the organization’s risk tolerance. Discuss the technical and business effects with stakeholders. A threshold that catches every variation may overwhelm analysts with false positives; one that tolerates too much activity may delay a response. Risk tolerance also helps determine which assets warrant closer monitoring and where to allocate resources. section 3.2.3 section 8.1.1
Turn metrics into action
An organization might permit at most five access-control violations per month, require 95% of systems to be patched within 30 days of vulnerability disclosure, and lock an account temporarily after three failed login attempts in a session. Each boundary answers a different operational question: whether to investigate access, improve patching, or restrict an account. The access-control limit can be checked against historical incidents and the normal baseline rather than chosen arbitrarily. section 3.3.3
Review thresholds as conditions change:
- Select an alert worth investigating and define what it monitors and why it matters. section 8.4.1
- Distinguish zero-tolerance events from policy limits and anomaly-detection alerts. The appropriate boundary depends on the alert category. section 8.4.1
- For anomalies, collect logs to establish a baseline; use historical data and behavioral analytics to distinguish ordinary variation from suspicious activity. section 8.4.1 section 8.3.1
- Reassess the boundary when threats, organizational needs, or observed alert quality change. Adaptive thresholds can accommodate legitimate behavior better than rigid limits. section 3.2.3 section 3.3.3
Figure 8.2 The left side shows SecureTech’s initial continuous monitoring metrics on their example dashboard. On the right are the improved numbers 6 months after analysis and corrections.
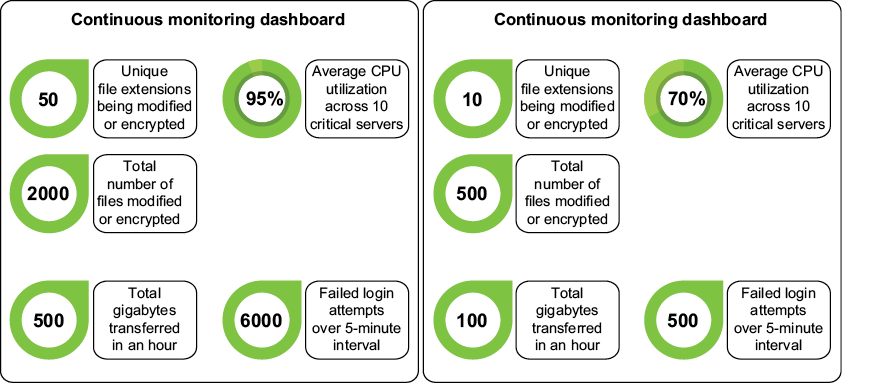
Compare the monitoring dashboard before and six months after alert analysis and corrections. The before-and-after view gives a starting point for discussing whether revised detection thresholds and supporting changes improved monitoring, rather than treating alert counts alone as proof. section 8.3.1
A threshold is a decision aid, not an inherently reliable verdict. Check whether it produces useful alerts without excessive friction. In biometric authentication, recalibrating sensitivity thresholds alongside other improvements reduced both false rejections and false acceptances; the trade-off was evaluated through those rates, not by assuming that a stricter setting was always better. section 8.5.5












