Suppose you want to predict whether a person will use an app often based on their age. You could start with a question: “Are they younger than 35?” The number 35 is a threshold, also called a cutoff. It divides the data into two groups, one on each side of the boundary. section 9.6
A decision tree asks a question like this at each decision node. For a numerical feature, it compares possible thresholds and chooses a split that works best for the predictions. It can then ask new questions within each resulting group. section 9.4 section 9.6
Choosing a boundary
In a two-feature classification example, a vertical boundary at x₀ = 5 separates squares from triangles and correctly classifies 8 of 10 points. Further boundaries split the groups on either side. You can compare candidate lines using accuracy, Gini impurity, or entropy. section 9.4
Choosing an age cutoff
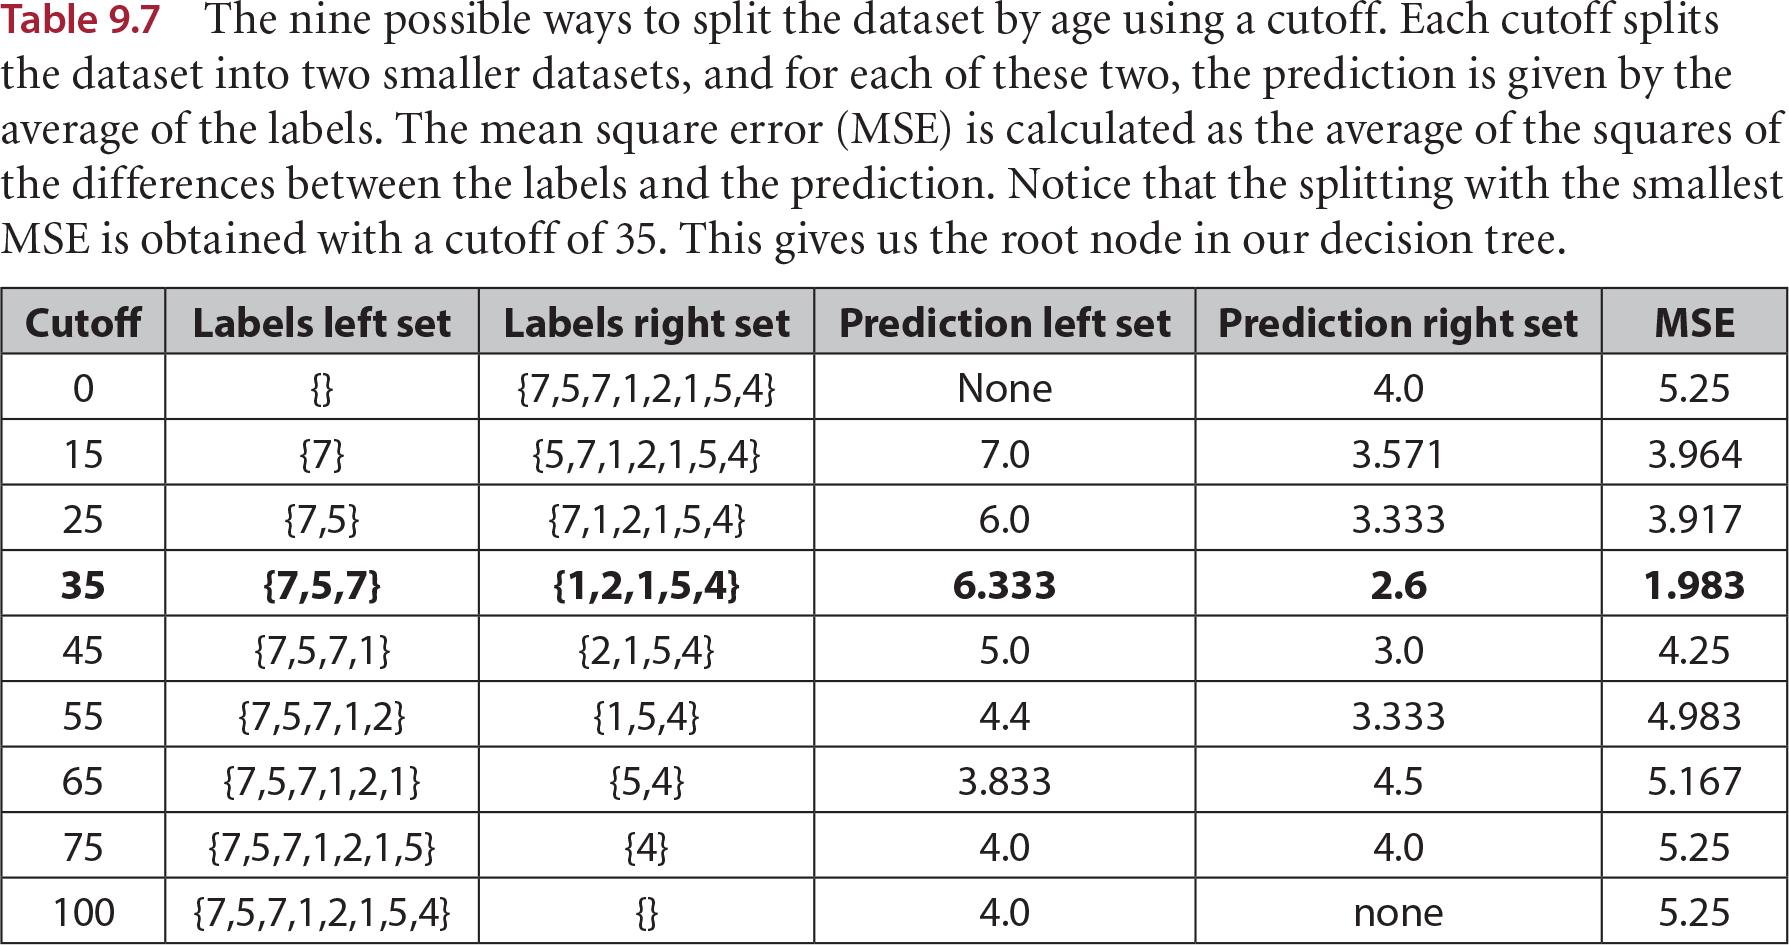
For app engagement, try age cutoffs such as 25, 35, and 65. At each cutoff, predict each group’s average engagement and calculate mean squared error. A cutoff of 35 gives the smallest error among those compared, so it becomes the tree’s first question. The same process can continue within each group. section 9.6
Table 9.7 The nine possible ways to split the dataset by age using a cutoff. Each cutoff splits the dataset into two smaller datasets, and for each of these two, the prediction is given by the average of the labels. The mean square error (MSE) is calculated as the average of the squares of the differences between the labels and the prediction. Notice that the splitting with the smallest MSE is obtained with a cutoff of 35. This gives us the root node in our decision tree. (view table figure)
| Cutoff |
Labels left set |
Labels right set |
Prediction left set |
Prediction right set |
MSE |
| 0 |
{} |
{7,5,7,1,2,1,5,4} |
None |
4.0 |
5.25 |
| 15 |
{7} |
{5,7,1,2,1,5,4} |
7.0 |
3.571 |
3.964 |
| 25 |
{7,5} |
{7,1,2,1,5,4} |
6.0 |
3.333 |
3.917 |
| 35 |
{7,5,7} |
{1,2,1,5,4} |
6.333 |
2.6 |
1.983 |
| 45 |
{7,5,7,1} |
{2,1,5,4} |
5.0 |
3.0 |
4.25 |
| 55 |
{7,5,7,1,2} |
{1,5,4} |
4.4 |
3.333 |
4.983 |
| 65 |
{7,5,7,1,2,1} |
{5,4} |
3.833 |
4.5 |
5.167 |
| 75 |
{7,5,7,1,2,1,5} |
{4} |
4.0 |
4.0 |
5.25 |
| 100 |
{7,5,7,1,2,1,5,4} |
{} |
4.0 |
none |
5.25 |
Compare the groups, predictions, and errors for the candidate age cutoffs to see why 35 is selected. section 9.6
A threshold can also act on a classifier’s score rather than on one feature. For example, a sentence scored by adding word counts is classified as happy when its score is at least 3.5; writing the rule with a bias instead uses −3.5. When selecting a model’s prediction threshold, raising it decreases sensitivity and increases specificity. That is a different choice from selecting a decision-tree split. section 5.1 section 7.4
Try plotting two numerical features, drawing a candidate vertical or horizontal boundary, and counting its classification mistakes. Could another threshold do better? section 9.4