A significance threshold is a probability cutoff chosen before interpreting a statistical test. Compare the returned p-value with the cutoff to make a binary decision about a null hypothesis: reject it when the p-value meets the threshold, or fail to reject it when it does not. A 5% threshold (0.05) is common, though 1% and 10% are also used. section 20.2 section 7.4.1
The threshold sets a high bar for calling a result consequential: 5% is somewhat arbitrary but low. It does not replace context, because statistical significance depends on the observed difference, variation in the data, and record count. section 7.4.1 section 20.2
Testing home versus road foul calls
For 2018–19 NBA games, a Welch two-sample t-test returned p = 0.02727 for personal fouls. Because 0.02727 is below 0.05, reject the null hypothesis that home and road teams have equal mean foul calls. The result is statistically significant under that predefined cutoff. section 7.4.1
Thresholds also guide data preparation and model choices. A Shapiro-Wilk p-value at or below 0.05 is treated as evidence that a variable is not normally distributed, while regression predictors with p-values below 0.05 are retained in a reduced model. section 5.5.2 section 5.7.6
Figure 20.2 Significance tests start with a null hypothesis that is subsequently rejected or not rejected based on a p-value with a 5% threshold. Which significance test to run is conditioned on the data (usually, but not always, continuous versus categorical). Significance tests are usually run from base R functions, and the results are typically visualized through packaged functions.
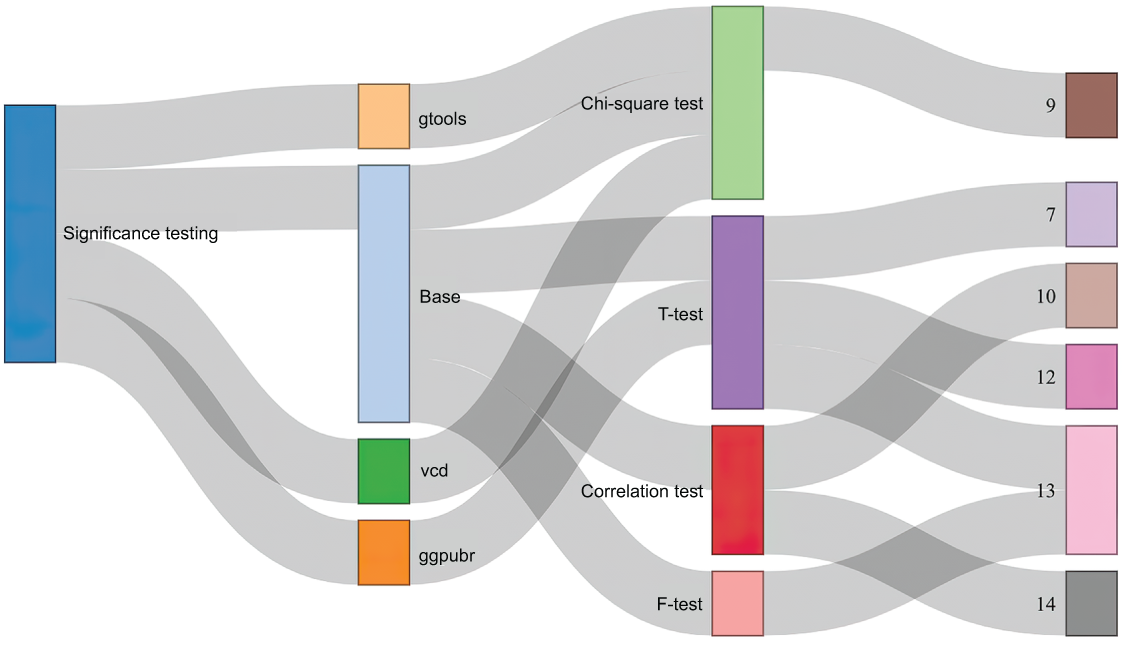
Use this decision diagram to trace a significance test from null hypothesis through p-value comparison to rejection or non-rejection. section 20.2












