A threshold is a boundary used to turn a measurement or count into a decision. In outlier detection, it might separate detector scores into flagged and unflagged records, mark a feature value for further investigation, or trigger an alert when anomalies accumulate over time. Its meaning depends on the quantity measured and the response attached to crossing it. section 3.3.4 section 15.3.1 section 1.1.5
A score threshold does not necessarily reveal a natural boundary between inliers and outliers. Scores often form a continuum, especially in noisy data. Inspect their distribution before choosing a cutoff, and check which direction indicates greater abnormality: with scikit-learn IsolationForest’s score_samples(), more anomalous records have lower, more negative scores. If the task is to investigate exactly 50 records, ranking scores and taking the top 50 can be more useful than forcing a binary cutoff. section 3.3.4 section 13.2 section 2.6
Figure 3.8 The distribution of outlier scores using FPOF on the SpeedDating dataset and KDE on the wall-robot-navigation dataset. In some cases, such as the KDE scores from the robot navigation dataset, we can identify a reasonable cutoff to separate inliers from outliers, while with the FPOF scores from SpeedDating, there is no clear cutoff.
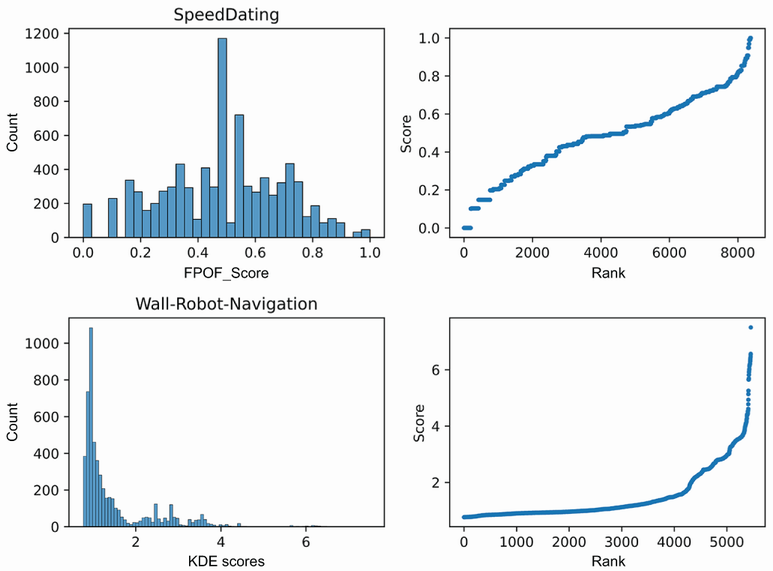
Compare score distributions: one suggests a workable cutoff, while the other has no clear separation. section 3.3.4
Set a threshold for the decision it must support:
- For a small number of numeric series, inspect plots to propose a value. A threshold near 1,300 for one plotted feature is plausible, but visual choices are subjective and imprecise. section 2.1.5
- For detector flags, first seek useful score rankings; then choose a cutoff for the needed balance of false positives and false negatives. Precision, recall, F1, and precision at k assess different consequences of that choice. section 8.5.2 section 3.3.4
- For a sensor process, count point anomalies over a suitable interval. Use the normal historical count to guide an alert or halt threshold; log lower-level incidents so recurring or escalating patterns remain visible. section 1.1.5
A threshold can also change how scores are combined rather than simply assign labels. In a detector ensemble, scores below a chosen value can be set to zero before taking the mean, reducing the influence of detectors that treat a record as an inlier. PyThresh or judgment can supply the boundary. This is an abrupt choice; averaging squared scores instead gives higher scores progressively more influence without a single cutoff. section 14.6.3
Sorting flagged network records
After selecting records with high detector scores, plot engineered Total Error Rate and duration against those scores. A Total Error Rate threshold of 200 can mark unusually high errors; a duration threshold needs tuning—the discussion suggests 2,000, while the sample rule uses 1,500. Matching rules attach explanations and weighted importance rather than treating every flagged record as the same kind of issue. Test the rules on flagged records and, ideally, unflagged ones too. section 15.3.1
Listing 15.6 Sorting outliers detected in KDD Cup dataset
top_scored_df = df[df['IF Scores'] > 0.1].copy()
top_scored_df['Total Errors'] = top_scored_df[error_cols].sum(axis=1)

top_scored_df['Label'] = 'Unknown'
top_scored_df['Importance'] = 0
for i in top_scored_df.index:
    row = top_scored_df.loc[i]
    expl = ''
    importance = 0
    if row['duration'] > 1500:
        expl += "Unusually long sessions. "
        importance += 1
    if row['Total Errors'] > 200:
        expl += "Unusually high error rates. "
        importance += 2
    if len(expl):
        top_scored_df.loc[i, 'Label'] = expl
        top_scored_df.loc[i, 'Importance'] = importance
The sample rules show separate thresholds for selecting scored records and attaching feature-based explanations. section 15.3.1












