A probability threshold is the cutoff that turns a model’s predicted probability into a yes-or-no decision. In logistic regression, 0.50 is a common default: probabilities below it become the negative class, while probabilities at or above it become the positive class. section 8.2
Think of the threshold as a decision dial, not a law of nature. A model may estimate a 97% chance of an event, but a threshold supplies the rule for acting on that estimate. Moving the dial changes which cases count as positives. section 8.2 section 8.10
Choosing when to head home
A toddler-meltdown model predicts a probability from hours without a nap. At a 0.50 threshold, a prediction of 0.50 or higher means “meltdown.” A cautious caregiver might lower the threshold to 0.30 and leave earlier. That catches more potential meltdowns (higher recall), but also creates more unnecessary warnings (lower precision). Raising the threshold does the reverse: fewer false alarms, but more missed meltdowns. section 8.10 section 8.2
Changing a threshold changes the confusion matrix and the kind of mistakes a classifier makes:
- Lower threshold: label more cases positive; increase recall while decreasing precision in the illustrated tradeoff. section 8.10
- Higher threshold: label fewer cases positive; increase precision while decreasing recall in the illustrated tradeoff. section 8.10
- Different threshold: produce different false-positive and false-negative counts, so a single fixed confusion matrix is not the whole evaluation story. section 8.10
Accuracy alone can mislead, especially when one class is much more common than the other. Compare thresholds with a ROC curve, which relates true-positive and false-positive rates; for imbalanced data, use a precision-recall curve instead. Area under the curve (AUC) summarizes performance across thresholds rather than committing to only one cutoff. section 8.10 section 8.11
Figure 8.8 The receiver operating characteristic (ROC) curve for my logistic regression toddler meltdown prediction, across different thresholds
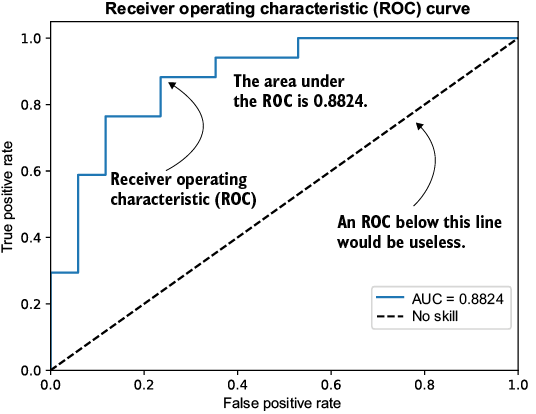
Use the ROC curve to see how the true-positive and false-positive rates shift as the decision threshold moves. section 8.10












