Throughput measures how much useful work a system completes per unit of time. A pipeline can allocate fewer promises yet still require wall-clock measurement: allocation counts are structural, while throughput depends on the workload and runtime. section 10.6.3
Compare models under identical conditions: move the same 4 KB chunks through equivalent transforms and sinks, then report the ratio measured on one machine rather than an absolute expectation. Node.js streams, async iterables, and Web Streams differ in per-chunk allocation and buffering, which can affect performance under load. section 10.6.3 section 10.6.4
Interpret throughput together with the costs that can constrain it:
- Measure wall-clock throughput separately from promise allocation; a 4 KB chunk allocates zero promises in the tested synchronous Node.js stream, eight through an async iterable, and twenty-seven through the tested Web Stream pipeline. section 10.6.3
- Honor backpressure: keeping about one chunk in flight holds memory flat, while ignoring it lets queues grow and memory climb. section 10.6.3
- Avoid repeated model conversion in hot paths; the measured throughput difference was roughly ten to fifteen percent, while extra allocations create garbage-collection pressure. section 10.6.4
A misleading performance signal
A pipeline can appear efficient because its allocation pattern is stable, yet perform poorly when conversion boundaries add buffers and backpressure propagation points. Diagnose the complete pattern—throughput, latency, memory, and garbage-collection behavior—rather than treating one metric as the explanation. section 10.6.4 section 11.0
Figure 10.8 Promises allocated per 4 KB chunk on Node.js v24. Node.js streams allocate none, paying their per-chunk cost in event dispatch instead; async iterables allocate eight; a Web Stream pipeline allocates twenty-seven. Exact counts vary by runtime, but the ordering holds.
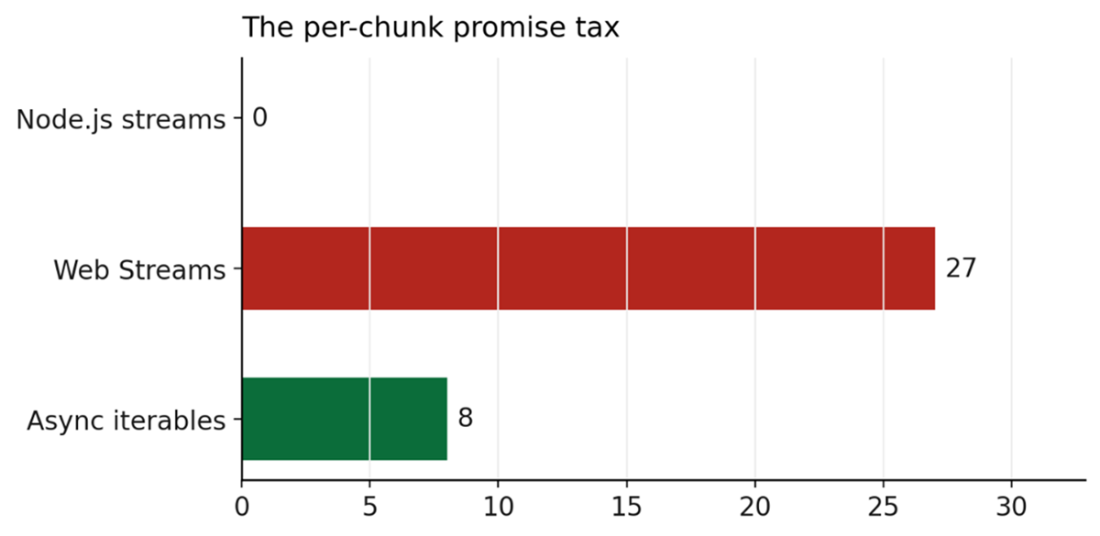
Use the allocation comparison to contrast the per-chunk costs of Node.js streams, async iterables, and Web Stream pipelines. section 10.6.3