How often does a classifier get the label right? Accuracy answers by counting correct predictions and dividing by the number of evaluated data points: accuracy = correct predictions / total predictions. If a model labels 875 of 1,000 test samples correctly, its accuracy is 0.875, or 87.5%. section 7.1
For a two-label problem, correct predictions are true positives plus true negatives. A confusion matrix also shows the mistakes—false positives and false negatives—that the single accuracy number combines. section 7.2
When 99% is not good enough
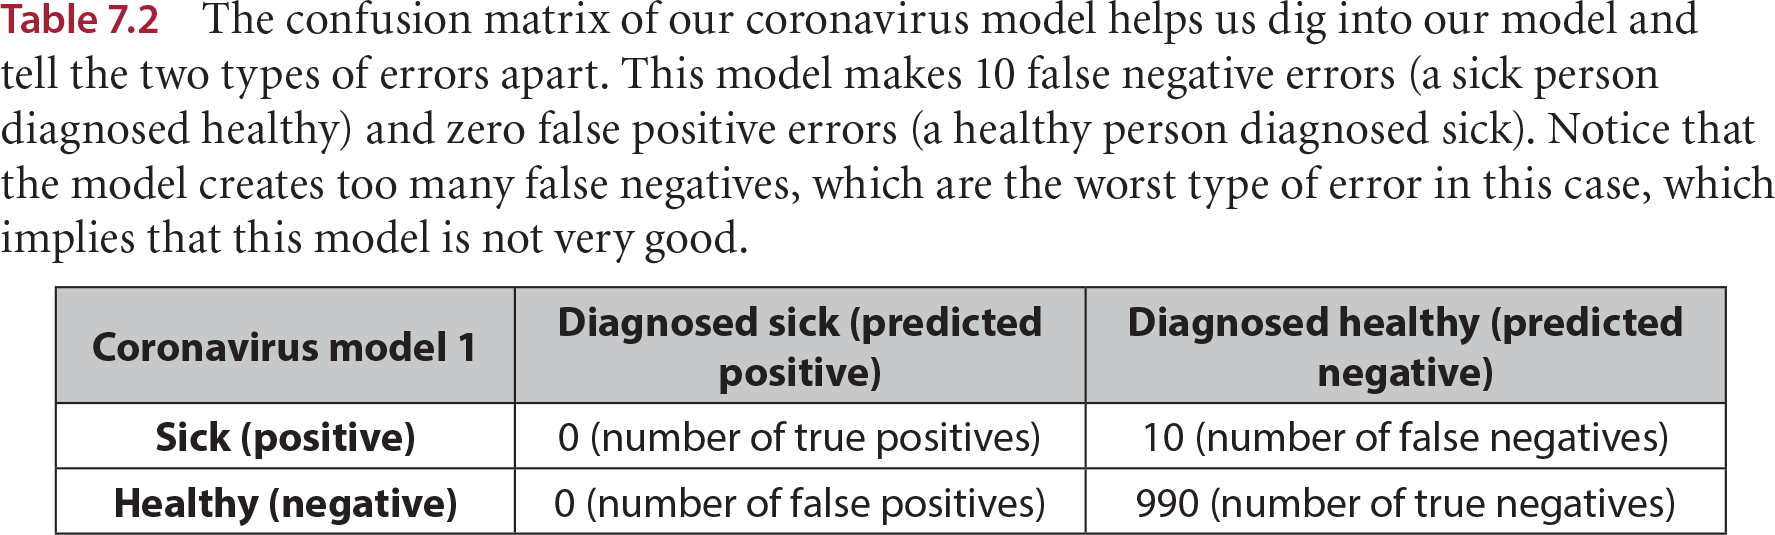
Imagine 1,000 patients: 10 are sick and 990 are healthy. A model that calls everyone healthy gets 990 predictions right, so its accuracy is 99%. But it misses every sick patient. High accuracy can therefore hide a serious failure when one label is much less common than the other. section 7.1 section 7.2
Table 7.2 The confusion matrix of our coronavirus model helps us dig into our model and tell the two types of errors apart. This model makes 10 false negative errors (a sick person diagnosed healthy) and zero false positive errors (a healthy person diagnosed sick). Notice that the model creates too many false negatives, which are the worst type of error in this case, which implies that this model is not very good. (view table figure)
| Coronavirus model 1 |
Diagnosed sick (predicted positive) |
Diagnosed healthy (predicted negative) |
| Sick (positive) |
0 (number of true positives) |
10 (number of false negatives) |
| Healthy (negative) |
0 (number of false positives) |
990 (number of true negatives) |
Read across the sick row: all 10 sick patients were diagnosed healthy, despite the model’s 990 correct predictions. section 7.2
Use accuracy as a starting point, then check which errors matter. Recall draws attention to missed positive cases, such as sick patients diagnosed healthy; precision draws attention to incorrect positive predictions, such as ordinary email marked as spam. A validation set can help compare candidate models, followed by evaluation on a test set. section 7.4 section 13.4
Try a small comparison
For each of two app-recommendation rules, count how many of six users receive the app they downloaded. Splitting users by platform gets four right; splitting by age gets five right. Their accuracies are 4/6 and 5/6, so age wins by this measure. section 9.2