Suppose an online store knows customers’ incomes, demographics, and purchasing habits but has no labels describing customer types. Clustering groups similar customers so analysts can inspect their behavior and plan marketing. The algorithm produces groups, not names for them: people must interpret what each group means. section 12.0 section 12.1.1
More generally, clustering takes unlabeled points and looks for structure by grouping similar points while separating dissimilar ones. A result may also reveal outliers or divide a large dataset into groups for separate processing. There is no single grouping rule that fits every dataset: cluster shape, density, and the desired output all affect the algorithm choice. section 12.1.1 section 12.1.2
Choose the form of output before choosing an algorithm:
- Hard clustering assigns each point to one cluster, or at most one when noise can be excluded. Soft clustering gives point–cluster membership probabilities instead. section 12.1.2
- Flat clustering returns one grouping. Hierarchical clustering records groupings at different stages; agglomerative clustering starts with individual points and repeatedly merges clusters. section 5.7.3 section 12.1.2
- K-means seeks a predetermined number of spherical clusters. DBSCAN groups by point density and can find irregular shapes, but struggles with varying density. OPTICS builds a density-based hierarchy that handles varying density. section 12.2 section 12.6
Build a k-means grouping
Given n points, a requested count k, and an iteration limit, create k random centroids. Assign every point to its nearest centroid, then move each centroid to the mean of its assigned points. Repeat assignment and recentering until assignments stop changing or the limit is reached. Keep both the centroids and point assignments. Random initialization matters: an unlucky start can produce poor groups or leave a centroid empty. Run the procedure with several initializations and compare the results. Direct distance checks across d coordinates take O(nkd) work per iteration, or O(tnkd) for t iterations; assignments and centroids use O(n + kd) additional space, excluding the input. section 12.2
Figure 12.3 An example of the k-means algorithm with k==3. Dataset points are initially lightly shaded. Step 1: k centroids (shaped as pentagons) are randomly created. Each centroid is assigned a different color: RGB. Step 2: For each point, measure the distance to all centroids, and assign the point to the closest one. At the end, each centroid C will define a cluster, a sphere centered at C and whose radius is the distance to the furthest point assigned to C. The clusters are highlighted in the same color as their centroids. Step 3: Update the centroids: for each cluster, compute its center of mass. Step 4: Repeat steps 2 and 3 j times. Some points will switch to a different cluster.
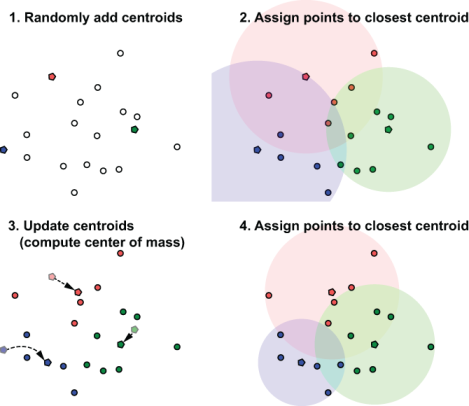
Follow the three-centroid example from random initialization through point assignment and repeated recentering; notice that points can change clusters between iterations. section 12.2
Check the result rather than treating any grouping as definitive. In a customer example, five centroids combine some apparent groups, while seven split one; six better matches the visible groups. The elbow method helps compare parameter choices graphically, and intra-cluster distance, inter-cluster distance, or cohesion can help assess a result. Such measures still require judgment: even an intuitive separation between two rings can be difficult to express with a suitable metric. section 12.5.1 section 12.1.2
Clustering can also depend on supporting structures. Nearest-neighbor search is central to DBSCAN and OPTICS; disjoint sets can support the repeated merges used in a distributed clustering algorithm. A regular spatial grid is not automatically a good substitute for accommodating clustered data: uneven density can leave many cells empty and overload a few. section 11.4.4 section 5.7.3 section 8.2.2

















