Clustering groups customers, teams, neighborhoods, or other objects by similarity. As an unsupervised learning method, it searches for patterns using input variables without a target or output variable. K-means is a multivariate technique that assigns observations to nonoverlapping groups around representative means, or centroids. section 11.0 section 11.5
K-means proceeds through a repeating workflow:
- Choose the number of clusters, K, before running the algorithm. section 11.0 section 11.5
- Randomly initialize K centroids, assign each data point to its nearest centroid, and recalculate each centroid as the mean of its assigned points. section 11.5
- Repeat assignment and recalculation until the centroids stop changing or a maximum iteration limit is reached. section 11.5
- Compare plausible values of K: too few clusters can oversimplify the data, while too many can overfit it. section 11.0 section 11.5
From customers to NBA teams
A department store can segment customers using prior purchases, age, gender, home address, and other attributes, then tailor marketing strategies to each group. An NBA analysis can similarly segment teams using payrolls and regular-season wins. A separate hierarchical analysis groups draft selections by mean career win shares and displays the result with a dendrogram. section 11.0 section 20.1
Figure 20.1 Hierarchical clustering was demonstrated in chapter 3 as the final piece of evidence supporting tanking; K-means clustering was demonstrated in chapter 11 as a way of segmenting like teams based on a combination of their respective payrolls and regular season wins. Our hierarchical clustering was developed and visualized exclusively with base R functions; conversely, our K-means clustering was mostly developed with built-in functions, but visualized through the factoextra package.
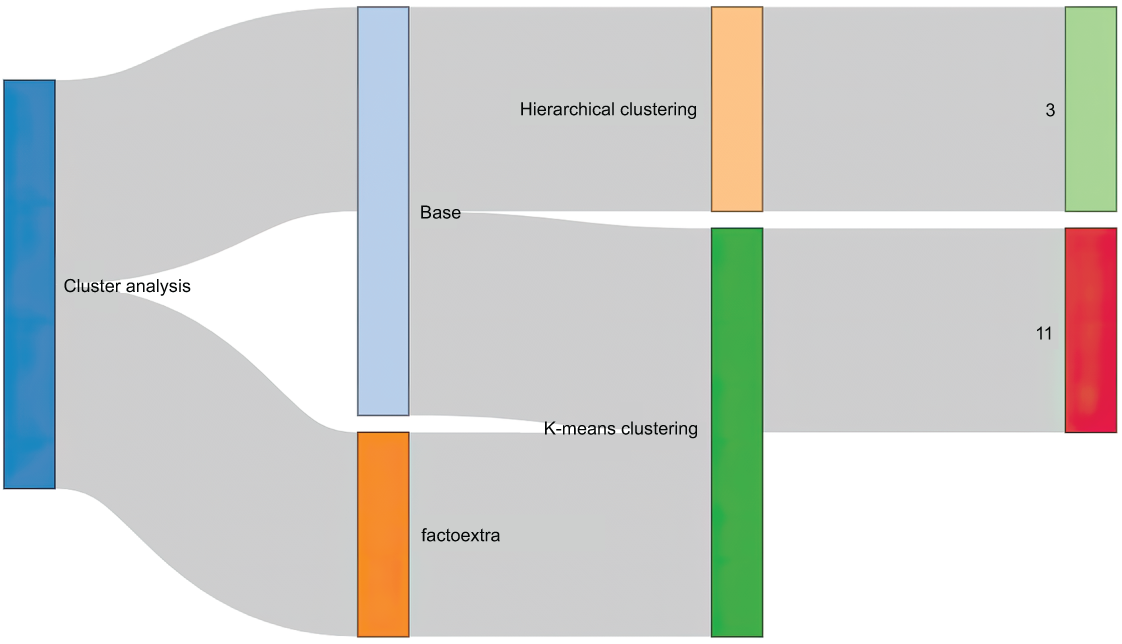
Compare hierarchical clustering and K-means clustering, including their NBA applications, R implementations, and visualization approaches. section 20.1

















