A retailer may have purchase histories but no labels describing its customer types. Clustering groups customers with similar attributes so the retailer can discover patterns and design more relevant offers. It is unsupervised: no target variable tells the algorithm which group is correct. A useful result has recognizable similarities within each cluster and meaningful differences between clusters. section 1.5.2 section 2.2
The attributes chosen for comparison shape the answer. Grouping customers by visits and revenue can produce different segments from grouping them by age and purchasing categories. Clusters therefore need interpretation in the context of the decision they will support, not just a plausible-looking plot. section 2.2 section 2.6.4
Figure 2.2 Using different attributes for clustering results in different clusters for the same dataset. Hence, choosing the correct set of attributes defines the final set of results we will achieve.
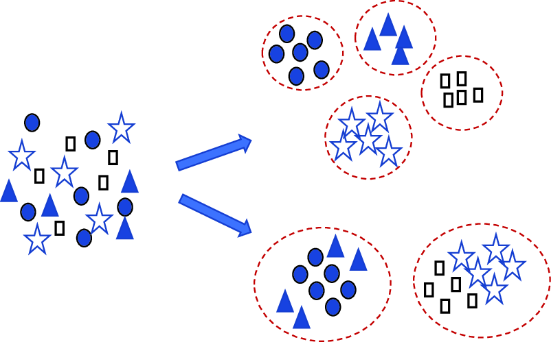
Compare the groupings of the same observations under different attributes before deciding what a cluster means. section 2.2
Choose a method that fits the data and the question:
- K-means assigns points to nearby centers and requires a chosen number of clusters; the elbow method can help select that number. section 2.10
- Hierarchical clustering builds groups through connectivity and linkage criteria without requiring a predefined cluster count. section 2.10
- DBSCAN groups points by density and distinguishes outliers; it does not require a predefined number of clusters. section 2.10
Similarity is not fixed. Centroid-based methods compare a point with its cluster center using distance; Euclidean, Manhattan, Chebyshev, and cosine are among the measures considered. Group membership also differs by method: hard clustering puts an object in one cluster, while soft clustering can associate it with multiple clusters. section 2.3 section 2.2
For a customer-segmentation workflow:
- Define the business problem and inspect transactions, customer attributes, missing values, outliers, and relationships between variables before finalizing the input data. section 2.6.4 section 2.7
- Try k-means and hierarchical clustering, varying their parameters. Examine cluster sizes and attributes; merge or split segments when the results are impractical to act on. section 2.6.4
- Check both cohesion within clusters and separation between them. A silhouette value compares a point’s fit with its own cluster against its fit with a neighboring cluster; a higher value is better. section 2.3.2
A mathematically tidy partition is not automatically useful: one cluster per customer would be pure but unactionable. Large, noisy, high-dimensional datasets also complicate the work. Options include dimensionality reduction and converting categorical inputs with one-hot encoding, while checking whether that conversion creates too many columns. Start with simpler algorithms before trying more complex ones when results are inadequate. section 2.3.2 section 2.7 section 5.7
Grouping unlabeled documents
For mixed football and travel sentences, convert the text to TF-IDF features, fit a two-cluster KMeans model in Python, and inspect the resulting centers and output. The same pattern can be tried on other text datasets. section 7.16

















