Data exploration, or exploratory data analysis (EDA), examines and summarizes dataset attributes to reveal property ranges, distributions, relationships, and inconsistencies before modeling. In ligand-based screening, it helps determine whether molecular data is curated well enough to support predictions such as hERG blocker classification. section 3.0 section 3.2.1
Use EDA to inspect risks that can distort pharmaceutical machine-learning results:
- Check missing values, data types, duplicate molecules, inconsistent SMILES, salts, mixtures, stereochemistry, and conflicting labels. section 3.2.1
- Inspect class balance, chemical-series bias, and train/test similarity because close analogs can leak information and inflate performance estimates. section 3.2.1
- Plot distributions to expose unusual values or annotation errors, including shifted potency measurements and inconsistent assay conditions. section 3.2.1
Exploring the hERG blockers dataset
A pandas inspection reports 587 rows across six columns: SMILES, Name, pIC50, Class, Scaffold Split, and Random Split. Names are missing for 22 records and pIC50 values for 61, while the class and split columns are complete. A histogram of pIC50 values provides a quick view of the measured potency distribution and can be compared with a deliberately shifted distribution to illustrate annotation error.
Figure 3.1 Key stages in our ML workflow.
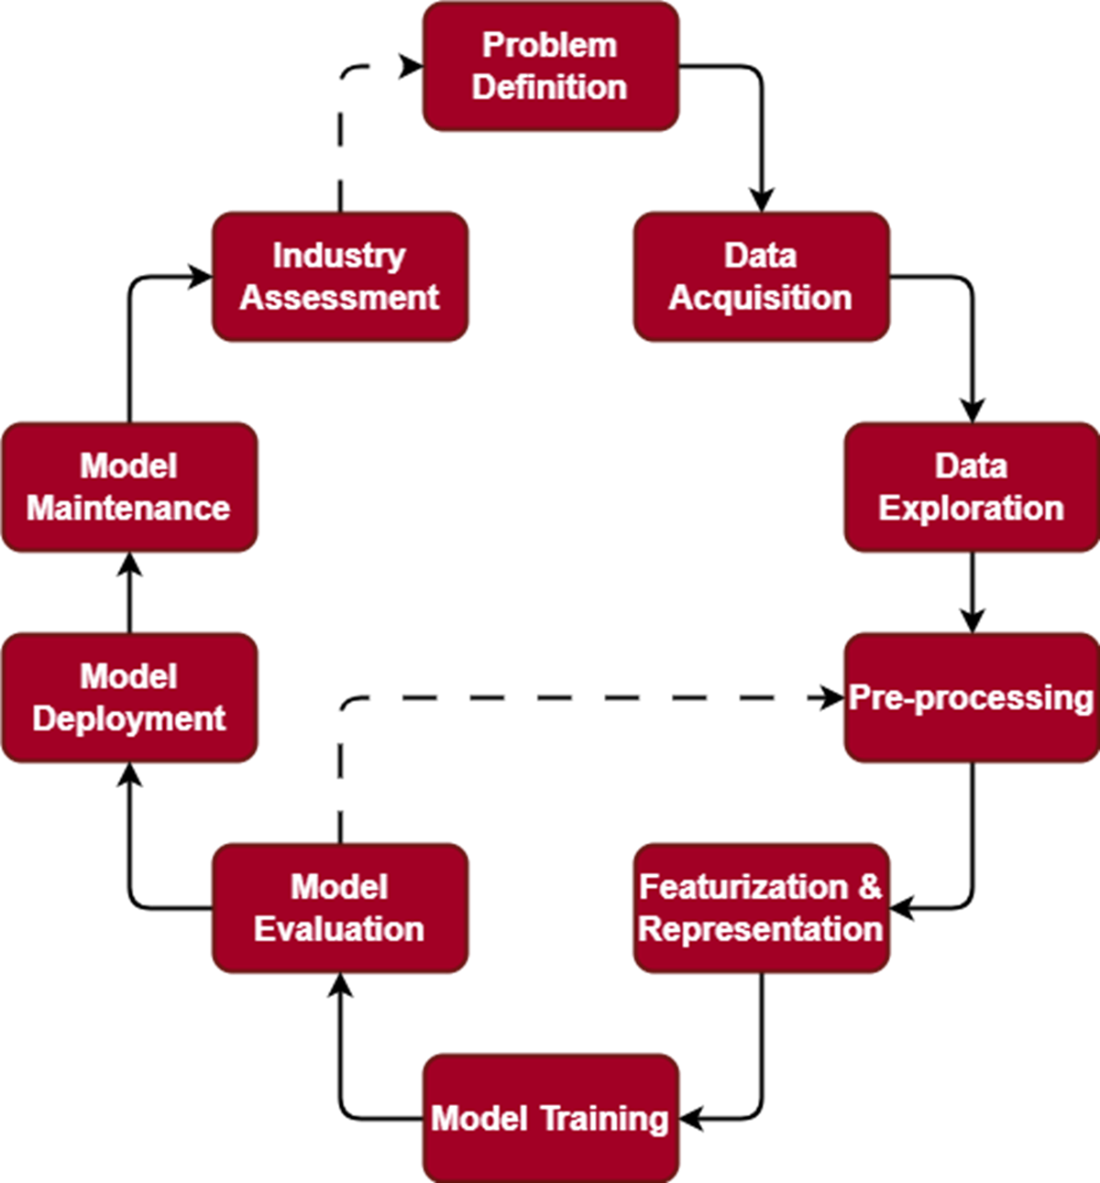
Use the workflow figure to place data exploration between data acquisition and preprocessing, while treating the overall process as iterative. section 3.0