Data exploration, often called exploratory data analysis (EDA), is a thorough first interrogation of a dataset. It combines basic statistics with visualizations to learn what the data contains, spot patterns or problems, and set the scope for later analysis. Explore after tidying and wrangling, but before testing hypotheses, fitting models, or drawing conclusions. section 1.3 section 17.4
A useful exploration moves from a concrete question to the variables that may answer it. It can examine one variable on its own (univariate analysis) and then compare it with others (bivariate analysis). The goal is not a sweeping conclusion; it is an informed view of distributions, relationships, data structure, and quality. section 2.0 section 2.5
A practical EDA workflow includes:
- Load, import, tidy, and wrangle data before interpreting it; these steps help avoid misleading results. section 2.0
- Compute descriptive measures such as means and medians, then pair them with charts rather than treating either as sufficient alone. section 1.3
- Inspect variable types, dataset structure, and missing values before relying on comparisons or models. section 17.4.2
- Use histograms, density plots, bar charts, correlation plots, and related views to investigate distributions and associations. section 1.3 section 17.4.2
- Let findings guide the next wrangling or analysis decision, while periodically checking that complex transformations preserved data integrity. section 12.10
Exploring NBA draft win shares
To investigate NBA draft data, focus first on win shares as a single performance measure. Summarize and plot win shares, then compare it with the remaining draft variables to identify associations or lack of association. Those observations can supply a focused hypothesis for a subsequent analysis rather than prematurely treating exploration as proof. section 2.0 section 2.5
EDA can be manual and deliberate or partly automated. Automated tools create many tables and plots quickly, freeing time for tests and models, but may produce irrelevant output or miss the questions that matter. A selective mix of automation and targeted manual work preserves speed while keeping analytical judgment in the loop. section 17.4 section 17.6
Figure 17.1 A screen capture of a data profiling report that was created by passing a data set as the only argument to a simple function from the DataExplorer package
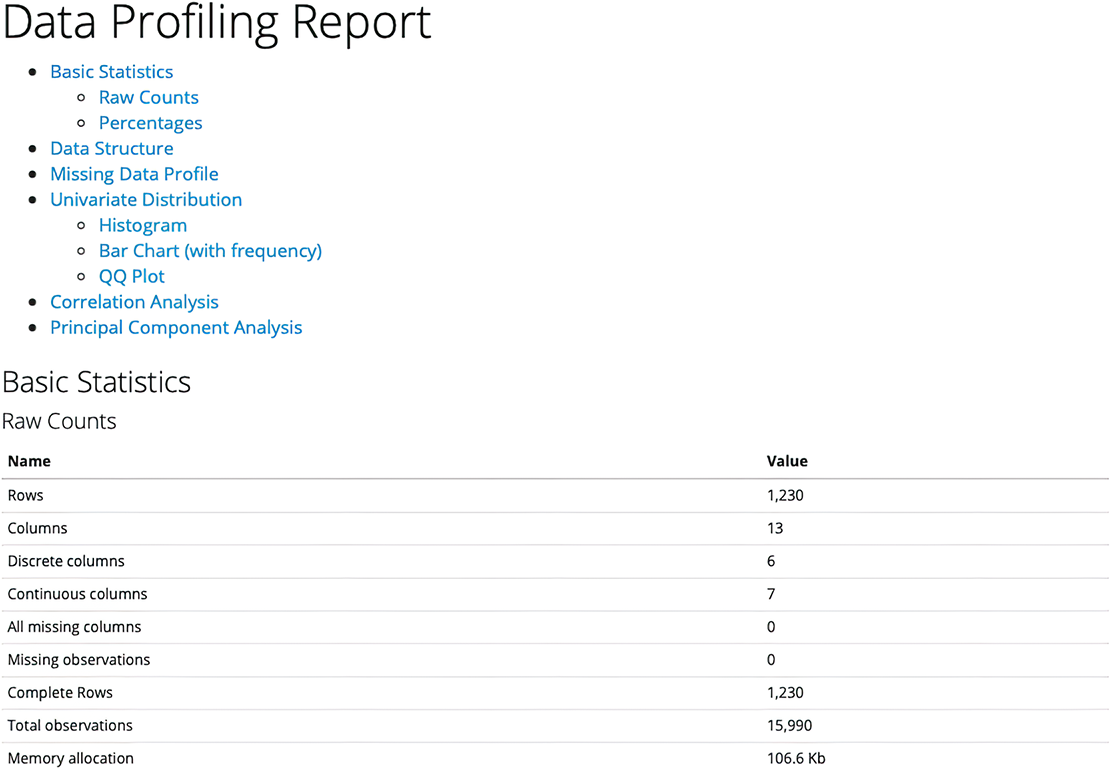
A profiling report illustrates how a single DataExplorer call can assemble an initial visual overview of a prepared dataset. section 17.4.2