Data exploration, or exploratory data analysis (EDA), systematically examines available data before modeling. Its job is to establish what the data contains, whether it is credible, and whether it offers enough information to pursue the project’s modeling goals. Start once the data is accessible and ready for analysis; use the data story and survey to choose questions rather than exploring without a plan. section 6.1 section 6.1.1
Put EDA in the backlog as a ticket to plan the investigation and share a report. Turn uncertainties into checks:
- Inspect typical and extreme records. Ask whether their values make sense in the business context. section 6.1 section 6.1.1
- Examine distributions and unexpected gaps, including calendar periods when activity should change. section 6.1.1
- Reconcile aggregates with external expectations, and test relationships between fields or entities. section 6.1.1
- Use plots and charts to reveal features and communicate findings; for unstructured data, begin with counts, sizes, and labels, then consider embeddings or mappings. section 6.7
Record the results, not just the queries. A shared report lets the team use the findings when deciding what to model and avoids repeating the investigation. Keep ethical, privacy, and security checks alongside EDA: a technically promising pattern does not by itself make a line of development appropriate. Simple baseline models provide a separate check on modeling potential and a measure for later progress. section 6.0 section 6.6.2 section 6.7
Checking sales data before modeling
A sales-data EDA asks whether totals agree with reported revenue, whether currency conversions and normalization are plausible, and whether markets and product groups have adequate coverage. In one investigation, sales extracted without deduplication and with naïve normalization looked implausible. After deduplication and better normalization, the aggregates became more plausible; their difference from published revenue was about 0.1%. The team also investigated negative and negligible revenue in recent periods rather than silently accepting the values. section 6.6.2
Figure 6.8 The same data treated for duplicates with a well-designed currency normalization process
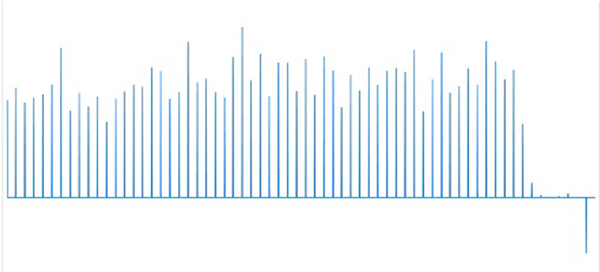
The treated-sales figure gives a visual checkpoint for the deduplication and currency-normalization checks; compare its aggregate pattern with the earlier naïvely treated extract. section 6.6.2
Use the earlier data survey to prioritize the investigation. Its known problems and integrity queries indicate where EDA effort is needed; issues that could jeopardize the project belong on the risk register and should be raised with the client. section 5.2.5