Data exploration analyzes a data set to reveal patterns, trends, relationships, structure, and quality issues before statistical modeling. It connects theoretical understanding with practical implementation and interpretation. section 4.2 section 1.5
A practical exploratory pass can:
- Assess the data’s structure and quality before applying a method. section 1.5.1
- Identify outliers, test normality, and examine variable relationships with correlation matrices and scatterplots. section 1.5.1
- Visualize a distribution and compare it with a reference curve when evaluating adherence to Benford’s law. section 1.5.1
Before fitting linear regression
Explore a data set containing paired numeric variables, investigate outliers and normality, examine relationships, and take corrective action before regression. These checks help determine whether model assumptions are adequately met. section 4.2
Figure 1.1 A process map that depicts how you should expect most of the subsequent chapters to flow. The linear component closely aligns with a typical statistical or quantitative problem at work or in the classroom, especially if we were to change out the theoretical background in favor of an opening problem definition. But there is also some nonlinearity due to mixing the underlying concepts with practice where and when it makes sense.
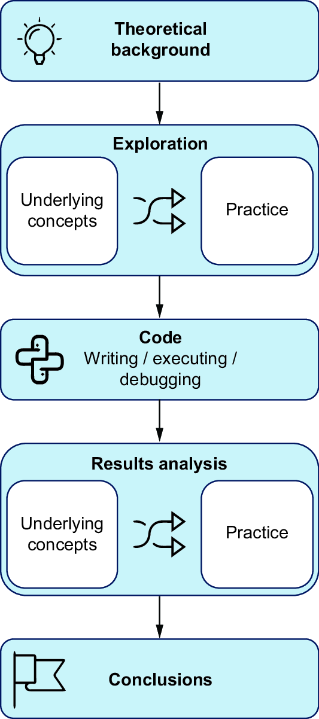
Use the process map to place exploration between conceptual foundations, practical analysis, and evaluation in a typical quantitative workflow. section 1.5