Observability makes a system’s internal behavior and health understandable through its telemetry and operational records. In an AI platform, isolated service logs are not enough: a slow response might come from model inference, retrieval, a guardrail evaluation, or a tool timeout. Unifying signals across the request makes it possible to locate the delay and understand its cost and outcome. section 7.0
Infrastructure health is only part of the picture. An assistant can return a fast, successful response that is nevertheless wrong or unhelpful. AI observability therefore treats response quality as a signal alongside latency and errors, with context about retrieval, model selection, token usage, safety evaluations, and cost. section 7.1 section 7.1.1
A platform observability service brings several signals together:
- Logs record events and decisions; metrics expose trends such as latency, errors, token consumption, and guardrail trigger rates. section 6.8.2 section 7.0
- Traces connect work across services, while spans identify individual operations. Generations and scores add model-output and quality context. section 7.0 section 7.5.4
- Cost attribution connects requests and token usage to workflows, models, or users, making expensive features and routing choices visible. section 3.8.3
Figure 7.1 Observability and experimentation architecture, spanning this chapter and the next. Platform services (left) emit logs, metrics, spans, and generations into the Observability Service (right), which routes them to four specialized stores. The SDK's ObservabilityClient buffers and flushes telemetry from developer workflow code. Dashboards and alerts consume traces, metrics, and scores. The Experimentation Service (bottom, built in the next chapter) evaluates production traces and writes the resulting quality scores back to the Score store.
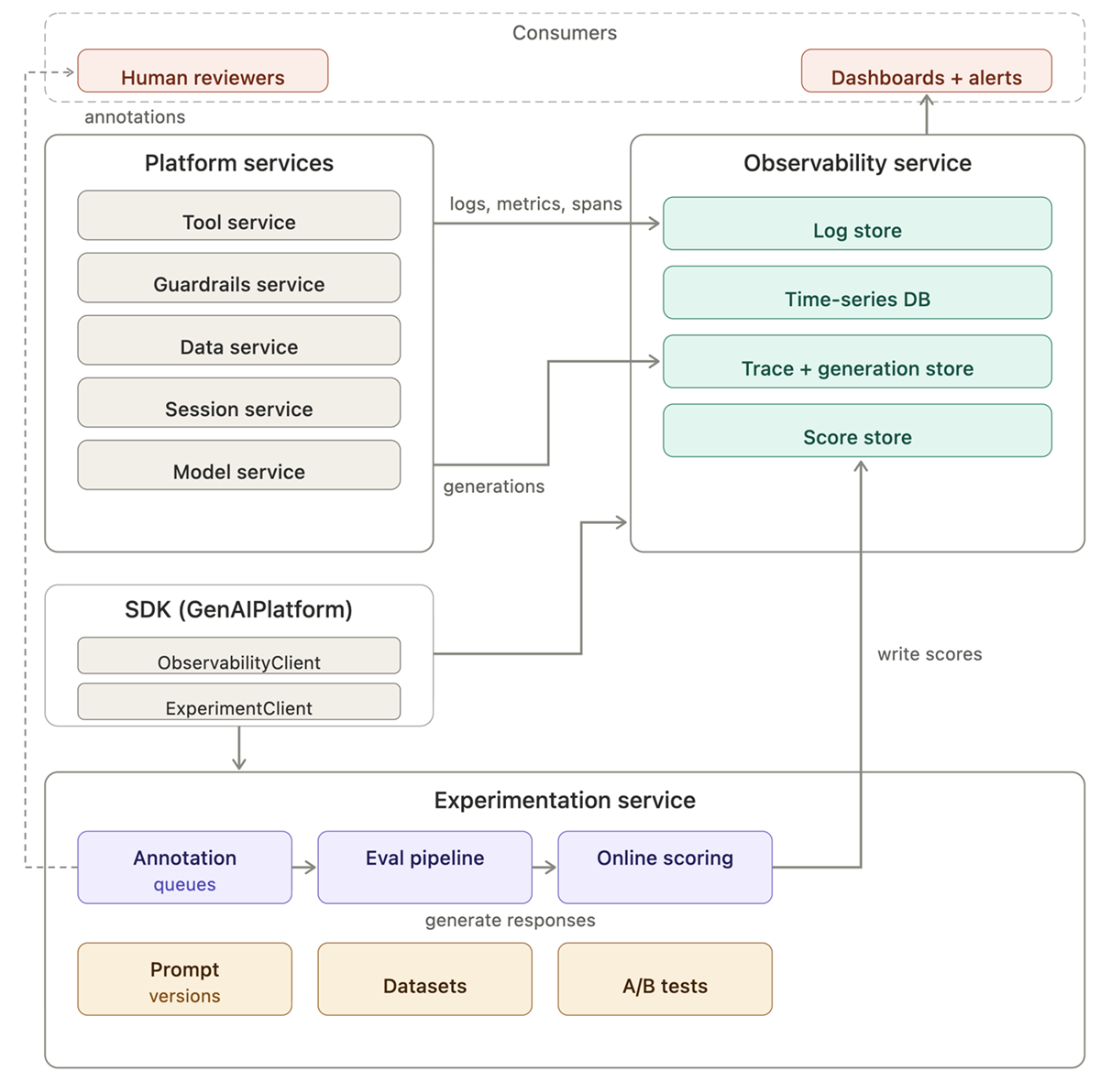
The architecture connects service telemetry and SDK instrumentation to specialized stores, dashboards, and alerts. Observability collects evidence; experimentation changes behavior and measures its impact. section 7.0
Automatic instrumentation covers standard platform service calls, but application-specific work can leave gaps. Use the SDK’s trace operation context manager around custom logic to create a span in the same trace. Custom metrics and structured logs can add context that the default instrumentation does not capture. section 7.5.4
Listing 7.10 Adding a custom span for application-specific logic
with platform.observability.trace_operation(
    "custom_rerank", trace_context,    #A
    num_candidates=len(candidates),
    rerank_model="cross-encoder",
) as rerank_ctx:
    reranked = my_reranker.rerank(candidates, query)
A custom reranking span records candidate count and model information while placing the operation in the existing trace. section 7.5.4
Safety decisions also need records, including evaluations that pass. Capture the inspection point, policies checked, triggers, and action taken; classifier confidence can support threshold tuning. Content hashes can correlate evaluations without logging sensitive content. When a guardrail silently modifies content, the original is stored encrypted with restricted access for compliance review. section 6.8.2
Investigating a slow workflow
If patient intake latency rises from 800 milliseconds to 2.5 seconds, metrics can reveal the change and traces can help locate the cause. Frequent fallbacks caused by provider rate limiting may point to load-based routing across providers rather than concentrating traffic on one. section 3.8.3 section 2.1.7