An outlier is an observation unusually far from a data set’s central or typical range. In threat hunting, outliers can represent noise, skew, or activity worth investigating. section 7.1.2 section 7.0
The interquartile range (IQR) identifies the middle portion of an ordered distribution between the lower and upper quartiles. Removing values outside that range reduces noise before calculating variance and standard deviation, especially when data is skewed or nonnormal. section 7.1.2
A practical outlier-handling workflow is:
- Group network events by source IP, destination IP, and destination port. section 7.1.2
- Calculate lower and upper quartiles for the timing values. section 7.1.2
- Drop rows whose time differences fall outside the IQR. section 7.1.2
- Calculate standard deviation, variance, and connection counts on the remaining data. section 7.1.2
- Remove duplicate connection groups and exclude known benign destinations before reviewing low-variance candidates. section 7.1.2
Filtering connection timing outliers
A pandas workflow drops rows below the lower quartile or above the upper quartile of time_diff_sec, then retains connection groups with low standard deviation. The resulting candidates include repeated connections to 162.125.2.14:443 and 40.87.160.0:23456. section 7.1.2
Figure 7.4 Quartiles for a nonnormal distribution
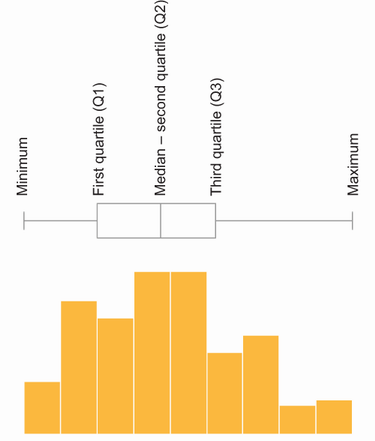
Use the quartile diagram to compare the middle range with values that lie unusually far from it in a nonnormal distribution. section 7.1.2













