An anomaly is an observation that stands apart from the pattern of the data. An online retailer averaging 1,000 daily transactions might record zero after a server failure—or 1,000,000 on an unusual day. Either value deserves investigation because outliers can bias an analysis. An unusual value is not automatically an error, however: an exceptionally wet year may matter greatly when estimating insurance claims. section 1.2.3 section 11.8
In DBSCAN, an anomaly has a specific meaning: it is a noise point, neither a core point nor reachable from a core point, so it receives no cluster assignment. DBSCAN forms clusters from dense neighborhoods. Its radius ε sets the neighborhood size, while minimum points (minPts) sets the density threshold. A core point meets that threshold; a reachable border point can join a cluster without meeting it itself. Points outside those dense, connected regions remain noise. section 2.5.2 section 2.5
Figure 2.29 Core points are shown as squares; border points are shown as filled circles, while noise is unfilled circles. Together, these three are the building blocks for DBSCAN clustering.
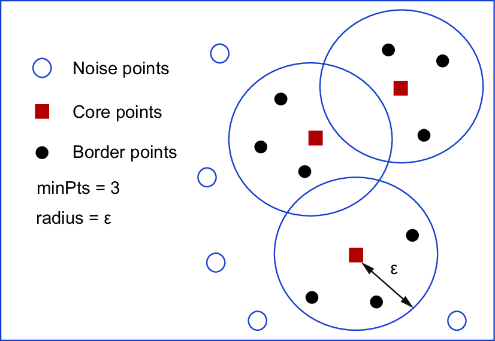
Compare the squares (core points), filled circles (border points), and unfilled circles (noise) to see why a sparse observation is left outside a cluster. section 2.5.2
This differs from k-means: an outlier can pull a centroid toward itself and still receive a cluster assignment. DBSCAN instead leaves low-density observations unassigned, while also accommodating irregularly shaped clusters. section 2.5 section 2.5.2
Inspect noise in a Python clustering workflow
Standardize the observations, fit scikit-learn’s DBSCAN with chosen `eps` and `min_samples` values, and inspect its `labels_` alongside a cluster scatter plot. A nearest-neighbor distance plot can help choose ε. Revisit the parameters and investigate observations left outside clusters before deciding whether they reflect poor data quality or meaningful rare events. section 2.5.2 section 11.8
For data-quality work beyond DBSCAN, possible outlier checks include percentile cutoffs, distance from the mean in standard deviations, and the interquartile range. Possible treatments include capping, replacement, or a log transformation. Highlight unusual observations first; change them only when the problem context justifies it. section 11.8













