liveBook · Manning

Anomaly

As explained in The Art of AI Product Development

An outlier is a data point whose behavior or value is anomalous relative to the dominant patterns in a dataset.

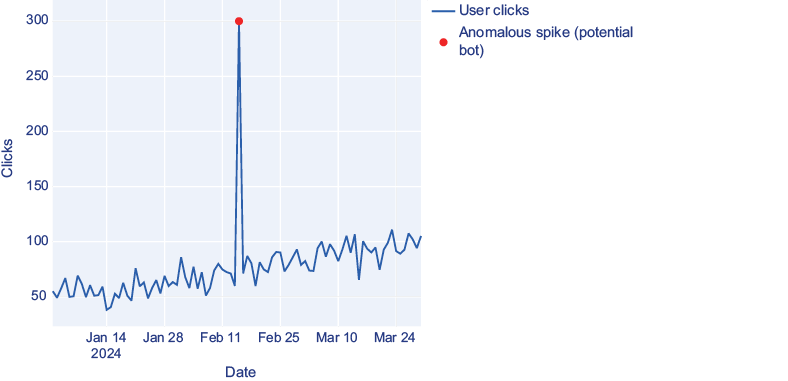
An anomaly is a sudden, unexpected deviation from typical behavior. In time-series data, it may appear as an extreme peak or trough; a short-lived spike may prove to be an outlier rather than a real trend. section 4.3.2 section 4.3.1

Unusual activity on an e-commerce site

A user who clicks endlessly without buying does not fit the discovered customer clusters. Investigating the behavior revealed a bot scraping the site, prompting the team to alert security. An anomaly is a signal to investigate, not an explanation by itself. section 4.1.6

Figure 4.6 Anomalies can show up as extreme peaks or troughs in the data.
A graph with a red dot

AI-generated content may be incorrect.

Extreme peaks and troughs can make anomalies visible in a time series. section 4.3.2

How The Art of AI Product Development covers it

How deep it goes
Defines anomalies as unexpected departures and illustrates peaks, troughs, and unmatched users without detailing detection algorithms.
Examples
Uses unusual clicking by a new user, a bot outside customer clusters, and a brief traffic spike as examples.
What you can do after
Diagnose unusual activity by investigating deviations, as with a user whose repeated clicks revealed a site-scraping bot.
How it connects
Connects anomalies to time-series analysis, clustering, and outlier filtering.

Also explained in

Compare how 14 books explain anomaly →

Related concepts

This explainer was generated by Manning's knowledge graph from the text of The Art of AI Product Development. The section links point to the parts of the book it draws on.












