An outlier is an observation that differs substantially from the usual pattern in a dataset. It is a prompt for investigation, not automatic evidence of an error: unusual activity may reflect a launch, promotion, viral post, legitimate exceptional transaction, or a data-quality problem. section 4.4.1 section 10.4.1
Inspect outliers early in exploratory analysis, alongside date coverage, missing values, category breakdowns, and distributions. First establish what the data contains and whether records cover the intended period; then identify values or daily counts that deserve explanation before they influence later analysis or prototyping. section 4.4.1 section 10.4.1
A practical investigation sequence is:
- Summarize or visualize the variable at the level relevant to the question, such as event counts per calendar day or descriptive statistics for sale price. section 4.4.1 section 10.4.1
- Inspect the unusual records and their related fields rather than relying on the extreme value alone. section 10.4.1
- Form plausible explanations from operational context, but distinguish those hypotheses from confirmed causes. section 4.4.1
- Make a documented treatment decision when warranted; for example, remove implausibly high sale-price records before subsequent analysis. section 10.4.1
Daily e-commerce activity
A chart of events per day reveals seven low-activity days in early November and three high-activity days in mid-November. The low days may precede wider platform adoption; the high days may reflect engagement growth, a viral social-media post, advertising, or a sale. Knowing the website launch date or campaign history would turn speculation into a more grounded interpretation. section 4.4.1
Property-sale prices
House-sale data is screened for price outliers before prototyping. Records below £1,000 are sampled and compared through category type, while properties above £300 million are inspected. A later filter retains sale prices below £10 million, separating an explicit cleaning decision from the initial detection step. section 10.4.1
Outliers can also be analytically meaningful. In customer segmentation, a small group of customers who spend far more than others may be an obvious group worth examining. Exploration therefore supports both data cleaning and the discovery of differences that can guide feature selection, clustering, and evaluation. section 12.4
Figure 4.6 Number of events per calendar day, visualized
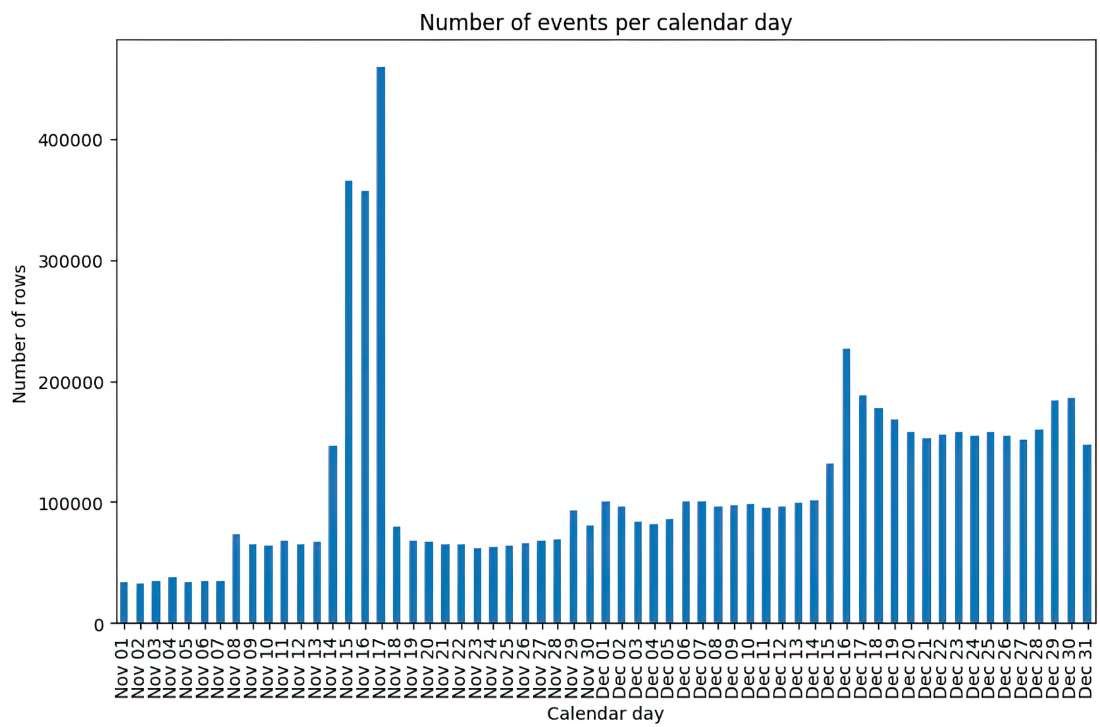
Use the daily event-count chart to spot unusually low and high activity before assigning a cause or changing the data. section 4.4.1













