An outlier is a data point that differs markedly from the rest. If nearly every transaction is from NY and one is from LA, the LA record deserves a closer look. It might be a data entry error—or a genuine transaction that matters. Either way, leaving it unquestioned can distort an analysis. section 2.5.3
Investigate before changing the data:
- Look for odd values. In pandas, `df['column_name'].value_counts()` can reveal values that occur only once; a singleton is suspicious only when the expected distribution makes it so. section 2.5.3
- Plot values over time. An unusual rise or gap in monthly review counts may indicate a collection error, a change in operations, or a significant business event. section 2.6.2
- Check relationships between variables. A point apart from a scatterplot’s pattern might reflect an error, unique circumstances, or a genuine extreme case. section 4.3
- Inspect the underlying records and use domain knowledge. Depending on what they represent, accept, remove, cap, or transform outliers; do not delete them merely because they look inconvenient. section 2.5.3
Unusual review-response times
To find unusual delays, calculate the time between each review’s creation and answer timestamps, then inspect its summary and a histogram or box plot. A Python workflow can use `df_order_reviews['time_diff'] = (df_order_reviews['review_answer_timestamp'] - df_order_reviews['review_creation_date']).dt.total_seconds()` followed by `df_order_reviews['time_diff'].describe()`. If seconds obscure the business question, ask an AI assistant to convert the result to hours or days and relabel the plot. Run and inspect the amended code: delays of many months call for investigation, not automatic correction. section 2.6.3
Figure 2.7 Distribution of the time difference between the review_answer_timestamp and review_creation_date columns represented as a histogram (a) and a box plot (b)
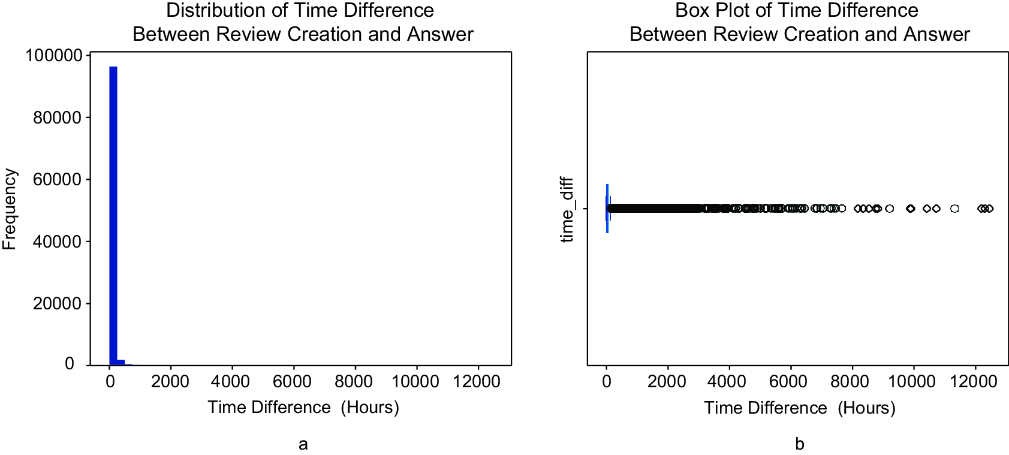
Compare the histogram and box plot of review-response times to see how unusually long delays stand apart from typical responses. section 2.6.3
Outlier checks belong both to data cleanup and to business analysis. Return to them as new patterns emerge: an apparent error may be evidence of an important event, while a striking chart point may not support a conclusion until its record is checked. section 2.5.3 section 2.6.2













