An outlier is a data point that differs significantly from other observations. In linear regression, checking for outliers is part of assessing the data and the model’s fit. section 4.1.3 section 4.3
When assessing outliers in regression:
- Use a scatterplot as one possible detection method, while recognizing that it may not be accurate. section 4.1.3
- Interpret transformations cautiously: they change the scale and the relationship described by the fitted model. section 4.1.3
A regression fit after removal
Removing one presumed outlier from eight points and refitting the regression changed the coefficient of determination from 0.88 to 0.95. section 4.1.3
Figure 4.4 A scatter plot that displays seven data points rather than eight. The one presumed outlier was removed, and another regression was fit. The coefficient of determination, which was previously equal to 0.88, is now 0.95. By removing one outlier, we’ve made a strong model even stronger.
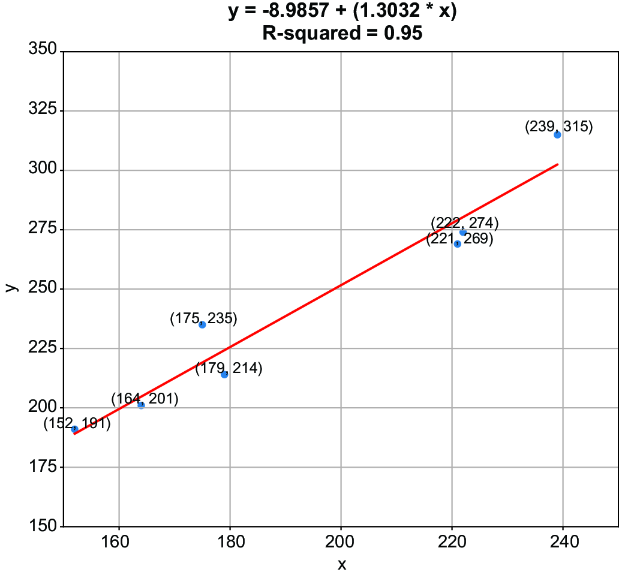
The figure shows the presumed outlier removed and the regression refitted. section 4.1.3













