Overfitting occurs when a forecasting model fits historical demand unusually well but fails to reproduce that performance on future or otherwise unseen data. It mistakes random variation for a meaningful demand pattern, creating confidence in historical accuracy that does not carry into planning decisions. section 10.1.2 section 14.4.2
The risk appears when a model is selected or optimized against the same historical period used to judge it. A model chosen from many alternatives may win in that period simply because it adapted to its peculiarities, then lose to a benchmark later. Compare forecasts with benchmarks at the same lag, avoid reusing the optimization period for evaluation, and keep tracking both over time. section 10.1.2 section 10.1.2
In demand forecasting, overfitting can result from:
- Using a fixed three-year history when it encourages the model to treat random fluctuations as trends or seasonality. section 14.1.2
- Selecting inadequate parameters or weights, or failing to represent important demand drivers such as prices and promotions. section 14.4.2
- Interpreting strong historical accuracy as evidence that the model will forecast actual future demand well. section 10.1.2
A forecast that wins the past
Suppose a forecasting system chooses one model from 15 candidates because it performs best in 2022. That model will probably beat a benchmark in 2022, but it may perform poorly in 2023 because it learned random features of the earlier period rather than repeatable demand behavior. section 10.1.2
Figure 14.14 Overfitting (left) vs. underfitting (right)
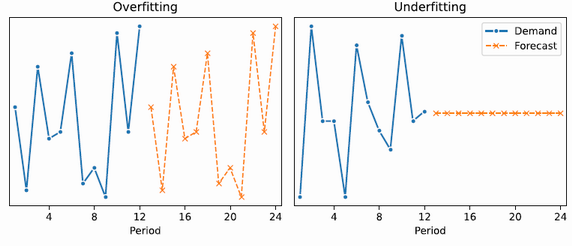
Use the figure to compare the visual signatures of overfitting and underfitting: one captures nonexistent seasonality, while the other misses actual seasonality. section 14.4.2























