Overfitting occurs when a model keeps improving on training data while its performance degrades on unseen validation data. In graph learning, diverging training and validation loss curves provide the clearest signal. section 3.1.4
Diagnose overfitting through a training workflow:
- Run training and validation loops for every epoch, recording both losses. section 3.1.3
- Plot the curves and identify the point where validation loss reaches its minimum before rising. section 3.1.4
- Retain the model instance with the lowest validation loss, then evaluate generalization on a separate test set. section 3.1.4 section 3.1.3
Graph model training
For the GCN and GraphSAGE models, validation loss begins diverging from training loss near epoch 20: training loss continues falling while validation loss rises. This indicates that additional training improves fit to the training graph data at the expense of generalization. section 3.1.4
Figure 3.1 Training and validation loss curves for the GCN model (left) and GraphSAGE model (right) trained in this section. The divergence of the validation from the training curve signals over-fitting, where the model learns the training data too well and at the expense of generalizing to new data.
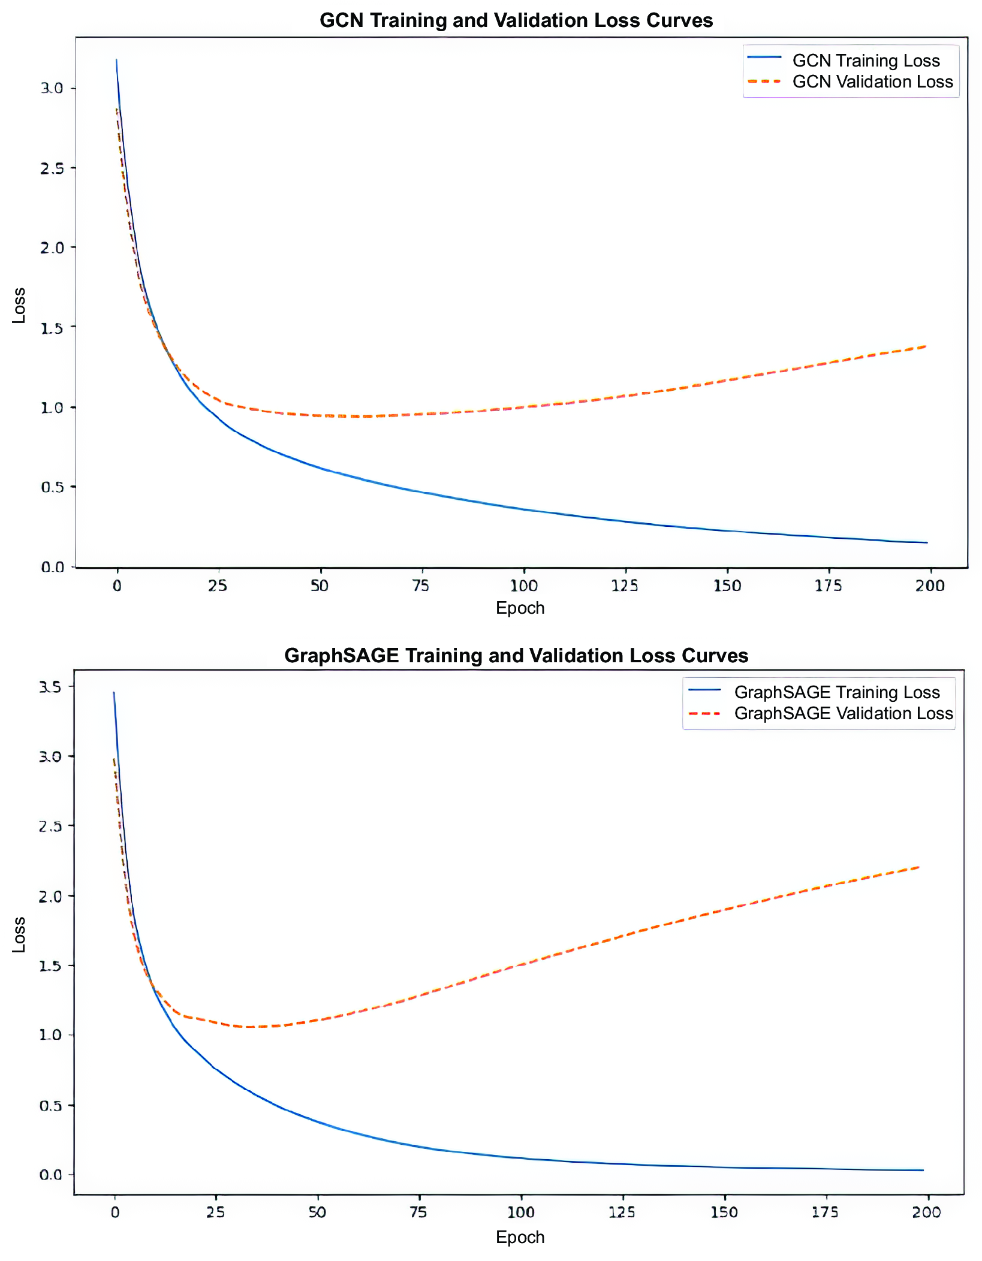
Use the paired training and validation loss curves to locate divergence and the best validation-loss point. section 3.1.4























