liveBook · Manning

Overfitting

As explained in Statistics Every Programmer Needs

Overfitting is a modeling condition in which a model captures idiosyncrasies of the fitting data at the expense of performance on new data.

Overfitting occurs when a model becomes overly tailored to training data, capturing noise or idiosyncrasies instead of patterns that generalize to new data. section 4.1.2

Adding predictors can increase R² even when they have little true relationship with the dependent variable, making R² alone insufficient for judging model quality. section 4.1.2

Removing an influential outlier

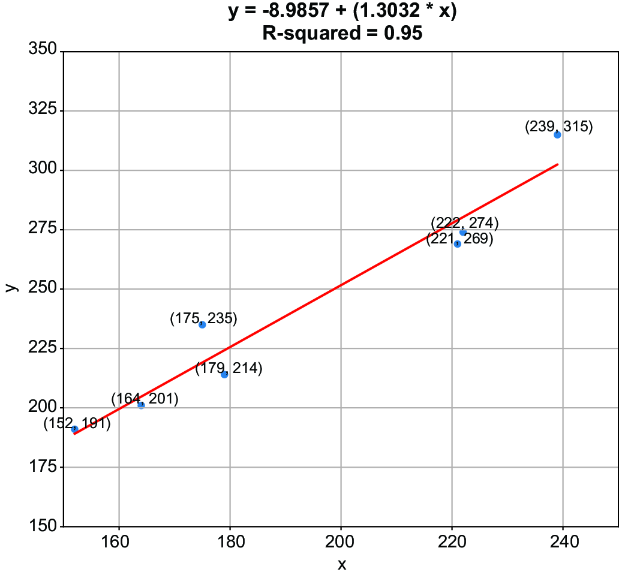
Removing one presumed outlier raised R² from 0.88 to 0.95, but the tighter fit could also reduce generalizability by overfitting the remaining observations. section 4.1.3

Figure 4.4 A scatter plot that displays seven data points rather than eight. The one presumed outlier was removed, and another regression was fit. The coefficient of determination, which was previously equal to 0.88, is now 0.95. By removing one outlier, we’ve made a strong model even stronger.
figure

Compare the regression before and after removing one of eight observations to see how an apparently stronger fit can conceal overfitting risk. section 4.1.3


How Statistics Every Programmer Needs covers it

How deep it goes
Defines noise-fitting and explains predictor-count and outlier-removal risks, but stops short of presenting a complete prevention workflow.
Examples
Uses added predictors and removal of one outlier that raises R² from 0.88 to 0.95 as concrete overfitting examples.
What it assumes
Assumes basic understanding of linear regression, R², predictors, residuals, outliers, and model assumptions.
What you can do after
Evaluate regression fit more cautiously by distinguishing higher R² from reliable performance on new data.
How it connects
Connects overfitting with linear regression, R², predictors, outliers, residuals, model assumptions, and generalization.

Also explained in

Compare how 24 books explain overfitting →

Related concepts

This explainer was generated by Manning's knowledge graph from the text of Statistics Every Programmer Needs. The section links point to the parts of the book it draws on.





















