A falling training loss can look like progress even when a fine-tuned model is getting worse on new inputs. Training loss measures how well predictions fit the training examples under the training objective; lower values mean a better fit. Validation loss measures performance on data the model has not trained on and is the more important signal for generalization. section 6.2 section 6.2.2
For supervised fine-tuning (SFT), loss can be reported as per-token cross-entropy over assistant tokens. In one full-SFT setting with 450 examples and three epochs, training loss typically starts around 2.0–2.5 and ends around 1.2–1.5. These values are specific to the setup, not universal targets. section 6.2
Plot training and validation loss against steps or epochs and interpret their trajectories together:
- Healthy convergence: both losses decline and level off at similar values. A small gap suggests the model is learning transferable patterns. section 6.2.2
- Overfitting: training loss keeps falling while validation loss plateaus or rises. Stop and use the checkpoint with the lowest validation loss; reducing epochs or adding data can help. section 6.2 section 5.1.2
- Underfitting: both losses remain high and flat. Check for a low learning rate, noisy data, or a max_length that truncates the assistant response. section 6.2.2
- Instability: loss oscillates sharply or becomes NaN. Reduce the learning rate by a factor of 5–10 and restart. section 6.2.2
Figure 6.3 The four training loss patterns encountered during fine-tuning.
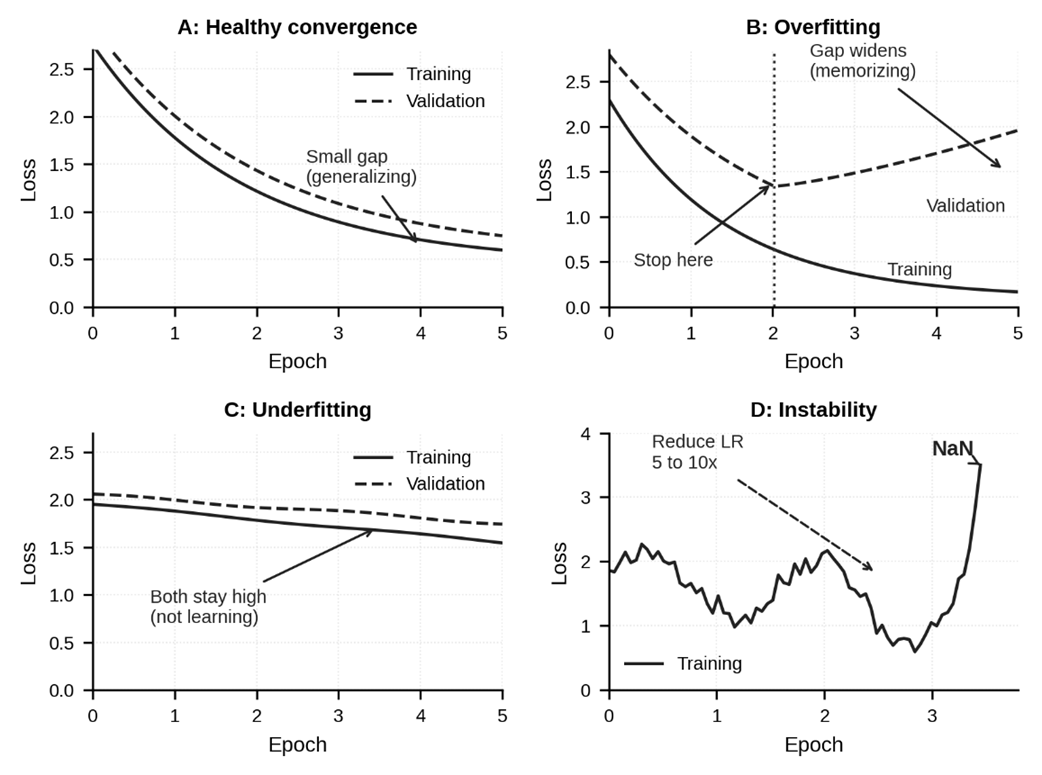
Compare the four loss-curve patterns before deciding whether to continue, stop, or restart a run. section 6.2.2
A small LoRA run
In a 20-step run on 40 IT support examples, training loss fell from 2.94 to 1.69, while evaluation loss moved only from 1.98 to 1.87. After roughly four passes over the data, the much faster training-loss decline suggests memorization. The run demonstrates that the pipeline works, not that the model has learned behavior transferable to new tickets. section 2.8
For 4B–7B models trained on 400–1,000 examples, a validation-to-training loss gap above 0.30 is a starting-point warning for likely overfitting, not an absolute rule. Watch gradient norms too: sustained values above 10 or NaN suggest reducing the learning rate, while an early spike alone is not decisive. section 6.2.3
Loss curves are a health check, not a complete shipping decision. Compare the fine-tuned model with its base model, define success thresholds before training, and run safety regression tests after each run. section 6.15