Will it rain today? “Rain” or “no rain” gives you a prediction, but not how much to trust it. A probability expresses uncertainty about the outcome and can help you decide whether to bring an umbrella. When the unknown is a quantity rather than an event, a probability distribution shows which values remain plausible instead of giving only one answer. section 1.1 section 1.0
In Bayesian reasoning, uncertainty reflects incomplete knowledge. You can express what you believe before seeing data, then update those beliefs with evidence. A frequentist view instead locates randomness in the process that produces data from a fixed unknown quantity. These are different ways of interpreting what a probability describes. section 1.0 section 1.6
Two sources of predictive uncertainty are especially useful to distinguish:
- Aleatoric uncertainty is inherent noise in the data; collecting more data cannot remove that noise. section 10.1
- Epistemic uncertainty comes from limited knowledge, such as sparse data; it can be reduced as knowledge improves. section 10.1
A single prediction cannot show either kind of uncertainty. For example, a standard neural network can fit observed values yet give an apparently confident prediction where it has no training data. A Bayesian neural network instead places distributions over weights and biases and produces probabilistic predictions. This matters particularly when observations are noisy or sparse. section 10.0 section 10.1
A most-likely answer is not the whole answer
Suppose five coworkers are surveyed about tea. The most-likely estimate of the proportion who prefer it is 0.6, yet that value has posterior probability only about 0.21. Other proportions remain plausible. To ask whether at least 80% prefer tea, add the posterior probabilities for 0.8, 0.9, and 1.0; the result is about 0.167. In Python, the same addition is `posterior[ps >= 0.8].sum()`. section 2.12
How should uncertainty be measured? For a continuous quantity, standard deviation can describe how spread out plausible values are. It is less helpful when possibilities are categories such as “dog” and “cat,” or when changing numerical labels changes the spread without changing which options remain plausible. Entropy offers a measure based on the probabilities assigned to possibilities, useful when choosing which data to collect. section 13.3 section 13.2
Figure 13.3 Standard deviation is sensitive to the scale of the data, even in scenarios where uncertainty about which value an unknown quantity takes is the same across different ways of labeling the data.
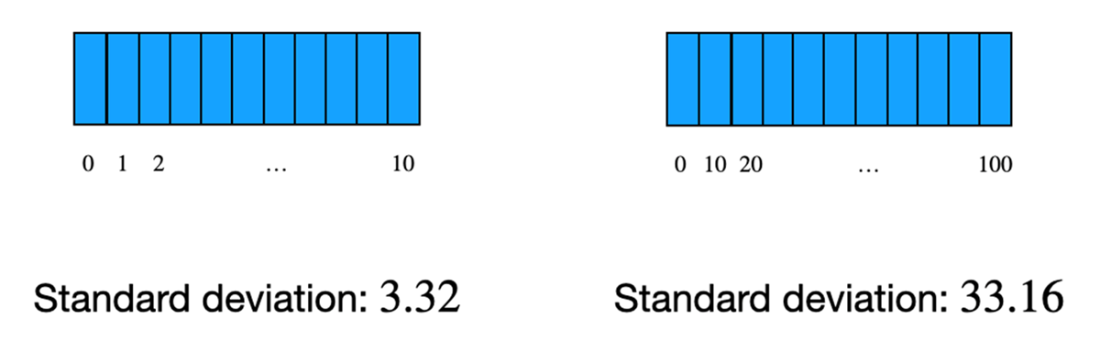
See why changing numerical labels can change standard deviation without changing uncertainty about which possibility is correct. section 13.3