An SS-tree must split a node when it has too many entries. Splitting along a poorly chosen coordinate axis can produce large, overlapping bounding spheres, forcing a similarity search to visit more nodes. Variance helps choose an axis on which the entries are spread out. section 10.3 section 10.3.3
For n values, the mean is their sum divided by n. The variance is the mean of their squared differences from that mean: variance(x) = Σ(xᵢ − μ)² / n. Compute this separately for each coordinate of a node’s entries. At a leaf, the entries are points; at an internal node, they are child centroids. section 10.3.3 section 10.3.4
A variance-driven split proceeds in two stages:
- Find the coordinate axis with the greatest variance, then sort entries by that coordinate. section 10.3.3 section 10.3.4
- Consider split positions that leave at least m entries on each side. Choose the position minimizing the sum of the two groups’ variances along the selected axis. section 10.3.4
Eight entries
With eight entries and a minimum of three per node, the split index can be 3, 4, or 5. Project the entries onto the maximum-variance axis and compare the sum of the two resulting variances at each index. section 10.3.4
Figure 10.18 Splitting a set of points along the direction of maximum variance. (Top) The bounding envelope and its points to split; the direction of maximum variance is along the y axis (center), so we project all points on this axis. On the right, we rotate the axis for convenience and replace the point labels with indices. (Middle) Given that there are 8 points, we can infer M must be equal to 7. Then m can be any value ≤3. Since the algorithm chooses a single split index, partitioning the points on its two sides, and each partition needs to have at least m points, depending on the actual value of m, we can have a different number of choices for the split index. (Bottom) We show the three possible resulting splits for the case where m==3: the split index can be 3, 4, or 5. We will choose the option for which the sum of the variances for the two sets is minimal.
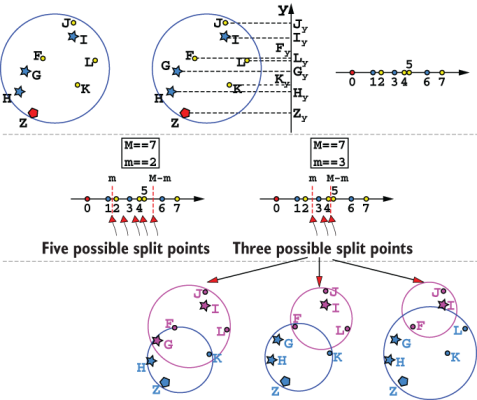
Shows the projection, eligible split positions, and variance comparison for eight entries. section 10.3.4
This axis-aligned heuristic is not guaranteed to find the best split: the direction of greatest spread might lie between coordinate axes. It is a practical way to limit sphere size and overlap without searching rotated directions. For n entries in k dimensions, scanning coordinate variances takes O(kn) time; sorting takes O(n log n). Recomputing both groups’ variances for every eligible split takes O(n²) time in the straightforward implementation. section 10.3.3 section 10.3.4


















