Variance measures spread by averaging the squared deviations of observations from their mean. It helps answer how close records tend to be to a typical value. A mean alone cannot answer that question: datasets with the same mean can have very different shapes. section 4.1.1 section 4.1.2
Use variance alongside a measure of central tendency and a view of the distribution, rather than as a complete description on its own. Check for skew, outliers, symmetry, and a meaningful center before deciding what to report. For a relatively symmetrical dataset, standard deviation is a useful related measure; when there is no meaningful center, a range, median, interquartile range, and visualization may communicate the spread better. section 4.1.1 section 4.1.2
Figure 4.16 Deriving the standard deviation and standard error from the initial variance calculation.
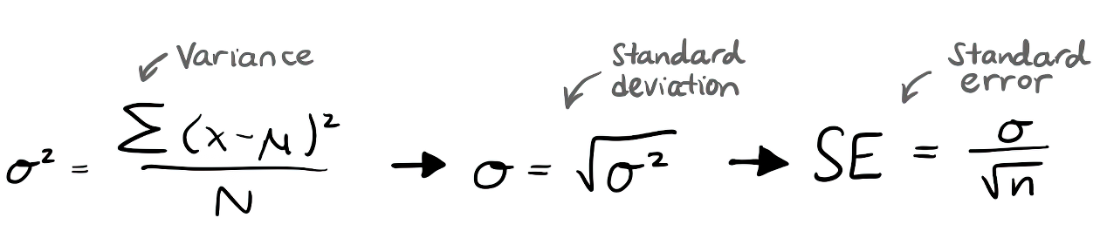
The diagram starts with a variance calculation and shows how standard deviation and standard error are derived from it. section 4.1.1
Before using a summary statistic to support a comparison or statistical test, examine what it reveals—and what it masks—about the data. Reporting spread alongside the center gives stakeholders a more useful picture than reporting one number alone. section 4.1.2 section 4.4


















