The area under the receiver operating characteristic curve (ROC AUC) measures how well a classifier ranks positive cases above negative cases. It can be interpreted as the probability that a randomly chosen positive case receives a higher score than a randomly chosen negative case. section 5.1.3
The ROC curve plots the true positive rate, also called recall or sensitivity, against the false positive rate. The false positive rate is the proportion of actual negatives incorrectly predicted as positive; it equals one minus specificity. Changing the decision threshold changes the trade-off between these rates. section 5.1.3
Figure 5.5 PR and ROC curves for the logistic regressor and the random baseline.
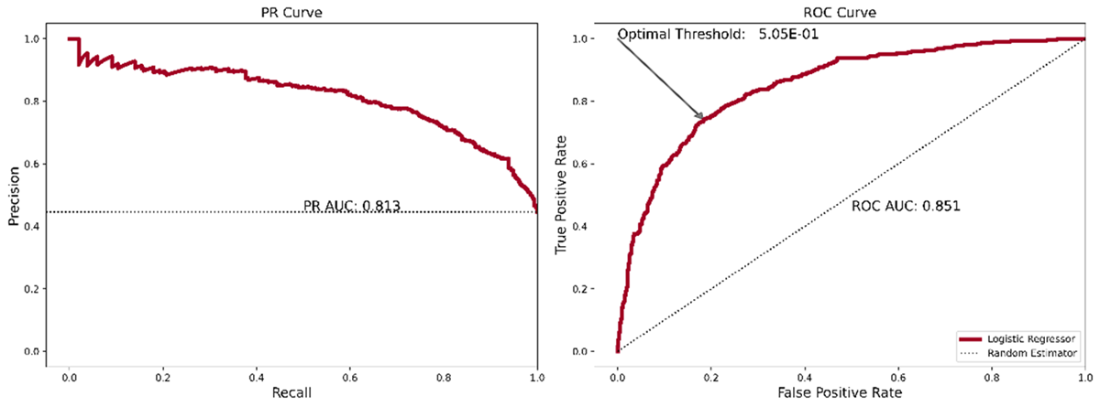
Compare the classifier’s ROC curve with the random baseline. A better curve moves toward the top-left corner. section 5.1.3
A perfect classifier has ROC AUC of 1; a random classifier has ROC AUC of 0.5. AUC is useful for comparing ranking performance, but the decision threshold still depends on the use case and the desired balance between precision and recall. section 5.1.3
Screening antibody sequences
An antibody classifier ranks sequences by whether they target HIV-1 or SARS-CoV-2, helping triage candidates for follow-up. Its reported test AUC is 0.8053, alongside accuracy of 0.7609 and F1 of 0.7580. Length-stratified checks and, ideally, external validation help assess whether the ranking generalizes; donor source, clonotype overlap and sequence length are possible confounders. section 12.3.4
Use a precision–recall curve when the priority is finding positives without too many false positives, or when the positive class is a minority. For an inhibitor dataset with about 41% positives, the choice reflects the practical importance of detecting inhibitors rather than a rare-positive problem. section 5.1.3