AUC measures how well a binary classifier separates its two classes across decision thresholds. It is the area beneath the receiver operating characteristic (ROC) curve: values closer to 1 indicate stronger separation, while 0.5 means performance no better than random guessing. section 7.15 section 7.18
Comparing three models
Imagine three ROC curves drawn on a grid whose squares each measure 0.2 by 0.2. Counting the squares beneath them gives AUC values of 0.52, 0.72, and 1. The model scoring 0.72 separates the classes better than the model scoring 0.52; the model scoring 1 is perfect. An AUC below 0.5 can be improved by flipping the positive and negative predictions. section 7.15
Use AUC alongside the ROC curve to understand threshold trade-offs:
- Increasing the decision threshold decreases sensitivity and increases specificity. section 7.18
- The ROC curve records sensitivity and specificity at each threshold, helping select a balance suited to the model's needs. section 7.18
Figure 7.5 In this figure, we can see that AUC, or area under the curve, is a good metric to determine how good a model is. The higher the AUC, the better the model. On the left, we have a bad model with an AUC of 0.52. In the middle, we have a good model with an AUC of 0.72. On the right, we have a great model with an AUC of 1.
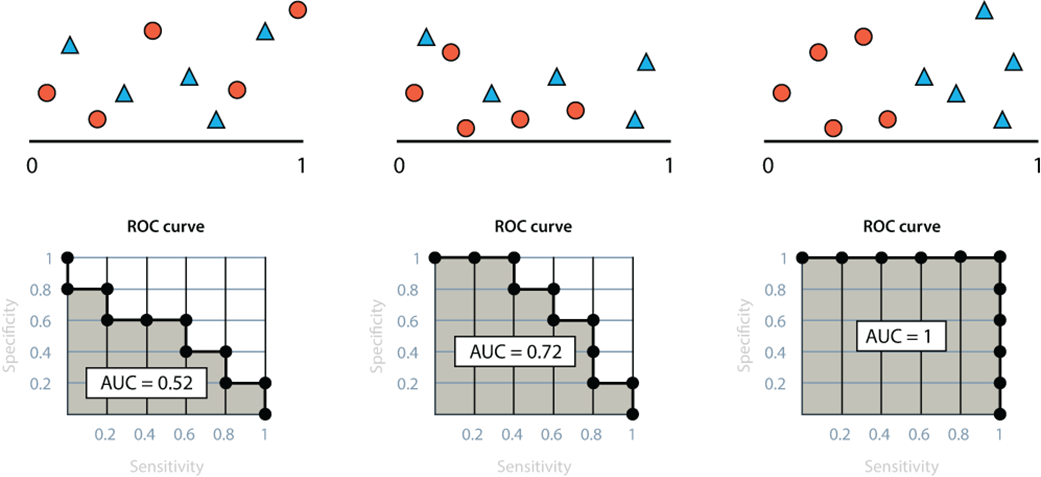
Compare ROC curves visually: the figure contrasts AUC values of 0.52, 0.72, and 1. section 7.15