Correlation measures how changes in one variable relate to changes in another. In a multivariate Gaussian, it captures whether variables tend to move together, apart, or independently, while the covariance matrix records these relationships alongside individual variances. section 2.2.1
Neighboring house prices
A nearby house with similar attributes provides useful information about the price of your own house: similar homes are expected to have positively correlated prices. A distant house with different circumstances may provide little relevant information, so observing its sale price barely changes your estimate. This is correlation supporting a Bayesian update. section 2.1
A multivariate Gaussian organizes correlation through its covariance matrix:
- The random variables form a vector with a mean vector and covariance matrix. section 2.2.1
- Diagonal entries of the covariance matrix give individual variances. section 2.2.1
- Off-diagonal entries give covariances, which are related to correlations between pairs of variables. section 2.2.1
- Positive correlation means that unusually high or low values tend to occur together; weak correlation transfers less information between variables. section 2.1 section 2.2.1
Figure 2.4 An MVN distribution groups multiple normally distributed random variables together. While the mean vector of the MVN concatenates the mean values, the covariance matrix models the correlations between the individual variables.
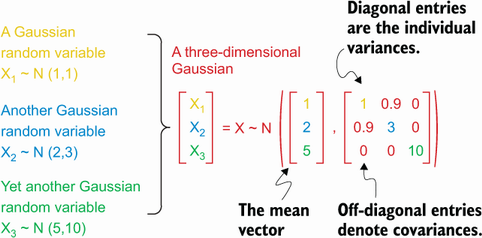
Use the figure to connect the mean vector with individual variable means and the covariance matrix with correlations among variables. section 2.2.1
Figure 2.5 Parallel coordinates plot visualizing a mean-normalized MVN from the housing price example. The error bars indicate 95% CIs of corresponding normal distributions, while the faded lines show samples drawn from the multivariate Gaussian.
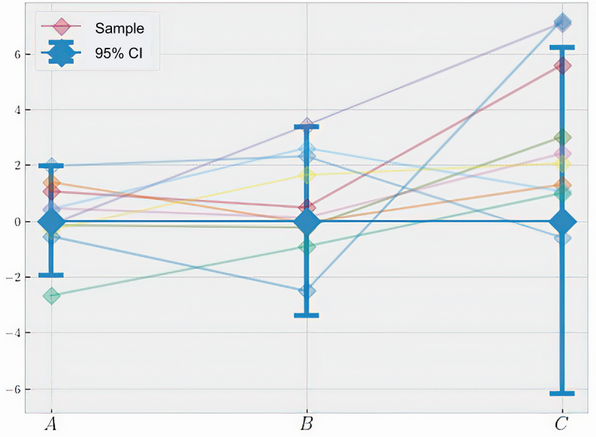
Use the parallel-coordinates visualization to see sampled joint behavior, individual uncertainty, and how correlated variables vary together. section 2.2.1















