Correlation measures the degree to which two quantities vary together in a linear association. In linear regression, it helps characterize the relationship between an independent variable and a dependent variable while a fitted line represents predicted responses. section 4.1.1
Interpret correlation through the direction and structure of plotted relationships:
- Positive relationships move together: increases in the predictor accompany increases in the response. section 4.1.1
- Negative relationships move oppositely: increases in the predictor accompany decreases in the response. section 4.1.1
- Neutral relationships show little apparent effect of one variable on the other. section 4.1.1
- Residual correlation indicates that regression errors remain related, suggesting that the model may have missed systematic structure. section 4.2.4
Checking correlation in a regression
Plot the observed variables to assess direction and strength, then plot residuals against fitted values. Randomly scattered residuals support linearity; a visible curve or funnel suggests unexplained structure. Use the Durbin–Watson test to assess residual independence: values between 1.5 and 2.5 generally support the no-correlation assumption. section 4.1.1 section 4.2.4
Figure 4.1 A scatter plot that displays eight data points, their respective x and y coordinates, and a regression line. The data points represent the observed data (for instance, when x equals 202, y equals 288, which has been highlighted and magnified). The regression line ties back to a simple linear regression that was fit on the data, where a response variable called y, which runs along the y axis, was regressed against a predictor called x, which runs along the x axis. It represents the linear equation at the top that can be derived from the model output, which is to say, it is also a representation of the predictions for y given x. R-squared is one of several metrics contained in the model output; it represents the percentage of variance in the response variable that can be explained by changes in the predictor.
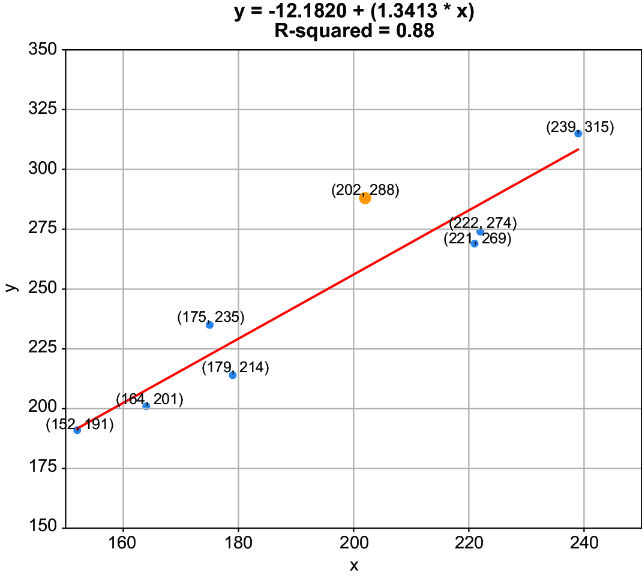
Inspect the scatter plot, observations, regression line, predictions, and explained variance together. section 4.1.1
Figure 4.7 A residuals plot that displays the fitted values from a linear regression on the x axis and the residuals from the same model on the y axis. Linearity between variables is confirmed when the data points do not follow any obvious pattern or trend.
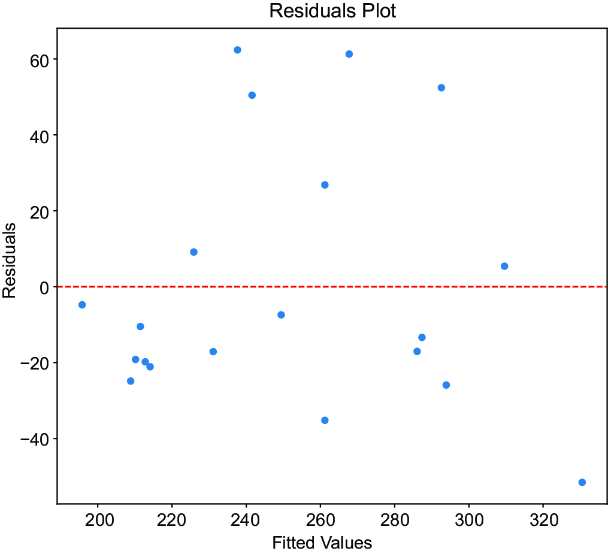
Inspect whether residuals form random scatter around the horizontal axis, supporting the linearity assumption. section 4.2.4















