Correlation describes two variables occurring or changing together. It can be useful for spotting patterns and making predictions, but it does not by itself show that changing one variable will change the other. A practical causal question is different: would an outcome change if an intervention changed? section 1.0 section 11.3
A correlation may arise because both variables share a common cause. Arcade revenue and computer science doctorates can rise together as population rises, even when neither directly affects the other. Before treating an association as evidence for a decision, ask what other variables could produce it. section 1.4 section 2.9
Figure 1.3 Link between arcade earnings and computer science doctorates. Although there’s a strong correlation, it’s possible to question whether there is actually a cause-and-effect connection. Source: www.tylervigen.com/spurious-correlations.
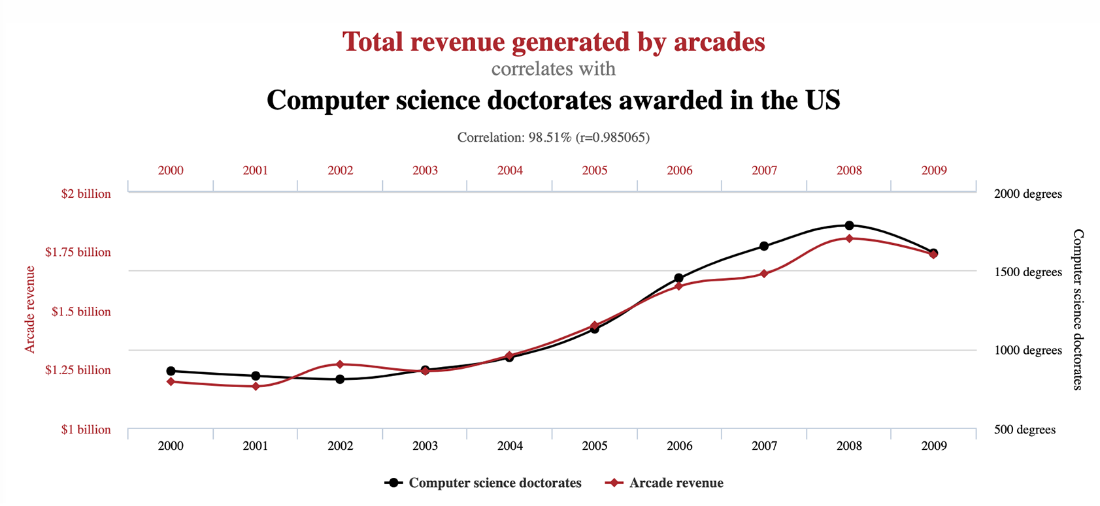
The unusually high correlation between arcade earnings and computer science doctorates is a prompt to question a causal story rather than accept one from the chart alone. section 1.4
Build a misleading correlation on purpose
Create population over time, then generate revenue and doctorates separately from population plus random noise. Revenue and doctorates can show a correlation near 0.95 despite having no direct link in the construction. Synthetic data makes the hidden data-generating assumptions visible and lets you test causal reasoning safely. section 1.4.1
In causal graphs, correlation can travel along causal paths and through paths with a confounder, but not through a path containing a collider. Conditioning on a confounder can close its noncausal path; the remaining association is then better aligned with the causal path. This is why choosing adjustment variables requires a graph and domain knowledge, not just a regression output. section 6.2.1 section 2.9
For normalized variables in linear graph models, calculate correlation by tracing eligible paths:
- Exclude paths that contain a collider. section 6.2.3
- Multiply the arrow coefficients along each remaining path. section 6.2.3
- Add the products across those paths, including causal and confounding paths. section 6.2.3
Correlation also has a constructive role in prediction. A synthetic control can use a highly correlated comparison time series to forecast an outcome after an event, provided the comparison series is unaffected by that event. The post-event gap between observed and predicted values estimates the event’s effect under that assumption. section 11.3















